Publications 2013
%202013_%D0%BE%D0%B1%D0%BB%D0%BE%D0%B6%D0%BA%D0%B0.jpg) Full text in Russian (pdf) |
No. 11 (74), 2013
Policy of the general education institutions according to outcomes of the survey of their heads
Authors: Irina Abankina, Maya Saveliyeva, Sergey Sigalov
The surevey has revealed that a high level of professional characteristics of the respondents being heads of general education institutions, such as an educational attainment, coverage of heads by additional professional education programmes, length of service had been preserved.
Contents
Introduction
1. Characteristic of parameters of the sociological survey of heads of general education schools in respect of their educational and economic strategies
2. Characteristic of institutions and their heads
3. Resources
4. Educational strategies
4.1. Admission of pupils
4.2. Teaching
4.3. Quality characteristics
5. Financial policy
Personnel policy
6.1. Payment of teachers' labour
6.2. Improvement of teachers' corps
7. Managing an education institution
Conclusion
Picture of a school head
The surevey has revealed that a high level of professional characteristics of the respondents being heads of general education institutions, such as an educational attainment, coverage of heads by additional professional education programmes, length of service had been preserved. An educational qualification of school heads is still high: 92.2% of the heads have a higher education. The first higher education of the school heads was obtained in the field of pedagogical sciences. The main specializations are “teacher of physics”, “teacher of history”, “teacher of russian language and literature”. A small proportion of school heads have a scientific degree of “candidate of science” (6.4%).
The gender imbalance of the directors’ corps is preserved. Still the overwhelming majority of school heads are women (79.2%) aged 40 to 59 years old having a length of service as a director over ten years. The proportion of women being heads of general education schools who are presented in the sample constitutes on the average 73.2% in all age groups except “below 30 years”. In this age group there are 66.7% of men who are heads of institutions. On the whole the survey has not revealed a tendency changes in the gender constitution of the respondents. Male directors of schools constitute for the sample on the average 20,4% of the directors’ corps.
Resources
As far as the provision of general education schools with the main kinds of resources is concerned, one may notice that a tendency of a high level of provision is preserved. For such kinds of resources as the personnel, training premises, training equipment, multimedia equipment, computers, financing, the level of provision remains higher than the “threshold” one, namely 80%. However the outcomes of the survey show that substantial financial injections in the budgets of general education institutions in the course of implementing the National Educational Initiative in 2010-2012 had lead to an increase of provision of general education schools with a wideband access to Internet resources.
This effects positively a possibility of implementing distant educational programmes, this being especially topical when organizing a net interaction with ungraded rural general education schools located in the regions which are difficult of access and from which it is impossible to organize a transportation of pupils to base schools.
Traditionally the outcomes of the 2012 survey confirm a high degree of development of network interaction: attacting the resources of other education institutions, institutions of the social sphere by using specific legislation (i.e. under a contract) is indicated on the average by almost half of schools.
The development of informational transparancy of schools, provision with educational services of a modern level, particularly pupils in the rural area, leveling the quality of educational services provided by an education system of a region to pupils of rural and urban schools by developing distant forms based on using Internet technologies were the most important directions of implementing the National Educational Initiative.
Financial policy
In 2011 in the regions of the Russian Federation there started the process of transformation of general education schools into new types of budgetary institutions stipulated by the new Federal Law on Education.
In this connection the respondents were asked a question: “Which type of new education institutions do you consider to be most acceptable for your general education institution?” Judging by the outcomes of the survey (the proportion of “No answer” was 93.5%) the heads of education institutions either do not pay attention or are not well-informed of the transformations and consequences related with changes in the typology of education institutions and rely on a founder’s choice.
Indeed the outcomes of the survey show that in most cases it is a founder in particular that initiates the conversion of an education institution into one of the new types. A founder monopolizes the its legally provided right of choosing a new type for an education institution.
On the part of an education institution itself the initiative is taken considerably more seldom. A school heads’ initiative is restrained by an established character of interrelations and communication between a founder and a school head that is supprted by the existing normative and legal base and law-enforcement practice.
The issues of changing financial indicators of general education schools are annually included in a questionnairy of a survey of their heads.
The changes of the financial position of general education institutions in the 2012 survey were compared (as in the 2011questionnairy) for the past three years.
As indicated by the respondents, the amounts of budgetary financing have changed considerably over the past period. One would notice a substancial growth of the amount of the fund of remuneration of teachers’ labour, fund of remuneration of an institution’s activity, norms of budgetary financing of schools.
At the same time in the non-budget receipts of general education schools did not display any changes as appraised by their heads. The amounts raised from activities that yield a profit do not exceed 4,4% in the structure of receipts of a general education school, while the budgetary funds constitute the lion’s share of receipts – from 78,8% at schools located in cities with the pupulation exceeding a millionaire people ( to 96,6% at rural schools. The changes in the structure of receipts of general education schools that followed the implementation of the Federal Law on Education stipulating, among other things, the provision of more freedom to education institutions in attracting (at the expense of activities that bring income) and consequently using non-budget funds have not so far produces a visible effect.
As far as the change in the amount of the fund of remuneration of teachers’ labour over the past three years is concerned, the answers “Growth” were given by practically equal shares of the heads (on the average 65.0% with a standard deviation 1.2%), i.e. the amount of the fund of remuneration of teachers’ labour depends slightly upon a type of a locality where a school is situated. No doubt, the decisive factor of influence on the distribution of respondents’ answers was the implementation of the National Educational Initiative and the “salary project” («зарплатный проект») in 2011.
Beginning with 2011 the ministry of Education and Science of the Russian Federation, jointly with regions of the Russian Federation, have started implementing a project of modernization of general education systems and increase of teachers’ salaries. In 2011 subsidies of 20 billion roubles were remitted from the federal budget to the budgets of regions of the Russian Federation.
It is safe to note that that an increase of an average salary of teachers took place at all comprehensive schools included in the sample.
The proportion of teachers in the staff who are capable to double their income owing to their efficient work with pupils, i.e. the proportion of a kind of “celebrities” in school team, is insignificant and constitutes 3.7% according to the heads’ assessment. It is necessary to note that the outcomes of the survey have confirmed that a positive trend was preserved as far as the norm of per capita financing of comprehensive schools is concerned.
Educational strategy
A new question was included in the questionnaire of the 2012 survey; it concerns the strategies of the classes completion at general education schools at different levels of education (primary, basic, senior). The heads of general education institutions declare that there are no barriers for children at the stage of the classes completion at primary school, but it is not in accordance with the facts. An existance of entrance barriers can be proved by a distribution of answers to the question regarding the enrolment at a preparatory department of a general education school. On the average 21.2% (in moscow 34.0%) of directors answered that the data on the enrolment (at a preparatory department) would grow or the admission would start this year. In Moscow 36.4% of directors (on the average for the sample this answer had been chosen by 35% of school directors) answered that the data on the admission to a preparatory department of a school will remain unchanged in comparison with the previous year. Thus in Moscow 70.8% of directors (34.2% on the average for the sample) confirmed that they use a strategy of selecting a pupil body for their school, this violating the legislation in the education sphere.
Beginning with the level “basic general education” when completing classes the respondents follow three main strategies. The first of them is completing classes of the basic school by pupils of the primary school. The second one means an additional completing the classes of the basic school by pupils from other schools; when vacancies are available it is done without a competition. The third strategy is less explicit. It provides for using a selection of schoolchildren who have mastered a programme of the primary school on a competition basis when completing the classes of the basic school.
As to the completing of the seniour classes, it was indicated that the strategy of completing the basic school classes was preserved. At the same time the applying of the strategy of selecting pupils on a competition basis when completing classes is more explicit (20.6% of answers). It is necessary to note that during the period that had passed since the previous survey of heads of general education institutions (2011) no changes in the educational strategies of heads of general education institutions were recorded.
Leading remains the strategy of providing various educational programmes. There is preserved a considerable scale of the schoolchildren coverage by a pre-profile and profile training. A pre-profile and profile training are in the greatest demand in cities with the pupulation exceeding a millionaire people, this being explained by a variety of opportunities for studying as far as the provision of the main kinds of resources is concerned: high-quality teaching personnel of a school; availability of teachers capable of implementing profile programmes and possessing teaching skills sufficient to teach at a more profound level; high class size and the number of classes of in 10th-11th grades (two or more).
It is for the first time that in the 2012 survey the respondents were asked questions about the structure of the pupil body at their school in respect of place of residence and mother-language. The outcomes of the survey show that pupils from households located close to a school have preference. The proportion of such schoolchildren is on the average 69.3% of the total number of those studying at a school.
The proportion of pupils for whom Russian is a foreign language is at a low level and constitutes 6.2% of the total number of pupils.
Personnel
An analysis of the 2012 survey data revealed that an age structure of the pedagogical personnel had not changed in comparison with the outcomes of the 2011 survey.
The proportion of young teachers is still small an is on the average equal to 12.3% of the total number of teachers.
As the outcomes of the survey had shown it is obviously a consequence of a small number of vacancies of teachers substituted by more experienced teachers of an elder age group. The fact that an age structure of the teachers corps is conserved is explained by preferences of school head when employing teachers.
An attempt to move forward in resolving the problem of the teachers corps renewal during 2012 was a failure. The measures of a social support of young teachers taken by the adminisration at the level of a region of the Russian Federation and a municipality did not lead to an expected effect.
As assessed by experts, there are indissoluble ties between an increase of the education quality and a growth of a pedagogical culture of teachers. Meeting the modern requirements in respect of professional skills of teachers is possible only if they participate systematically in the programmes of improving their qualifications in various forms and at different levels. A continuity of a professional development of the personnel of an educational institution that implements the basic general education programme should be provided by means of mastering additional professional education programmes with a duration of 72 hours and every 5 years at education institutions having a license for the right to execute a given type of an educational activity.
According to outcomes of the 2012 survey the proportion of teachers who had mastered the programmes of professional qualifications improvement was 41.3% of the total number of teachers. Among them there were only 9.4% of teachers who participated according to the personified model.
Managing a general education institution
The outcomes of the survey of heads of general education institutions testify to the fact that the proportion of schools that have an govering body is about 60.7%.
Other forms of the public participation in managing a school are applied on a smaller scale. It concerns such forms as a board of trustees and a supervisory council.
The questionnaire of the 2012 survey included a question containing a model list of issues regarding which an govering body makes managerial decisions. The outcomes of the survey give an idea of priorities that are on the agenda of govering bodies. First of all these are issues getting agreement on the distribution of incentive payments, confirmation of a programme of an education institution’s development, getting agreement on the amendments and addenda in the charter, local acts of an education institution, confirmation of a public report of an education institution, getting agreement on a regimen of studies, getting agreement on the rules of a routine, getting agreement on indicators and criteria of assessing the quality and efficiency of work of the education institution’s personnel.
Prepaied by Sergey Sigalov
%202013_%D0%BE%D0%B1%D0%BB%D0%BE%D0%B6%D0%BA%D0%B0.jpg) Full text in Russian (pdf) |
No. 10 (73), 2013
Teachers of professional education institutions on the market of educational services in 2010-2012
Author:Yana Roschina
Activities aimed at reforming the system of professional education have been implemented in Russia since early 20ies. In order to retrace the changes, including motivations, incomes and working time, labour practices, problems and expectations of educational personnel, in the framework of Monitoring of education markets and organizations (MEMO) during several years Higher School of Economics has been conducting special research
Contents
Introduction
Personnel potential of educational staff 6
Types of labour motivation 14
Differentiation of working time and salaries 19
Second employment and research activity 28
Dissatisfaction with work and career perspectives 41
Human capital and its usage 51
Conclusion 57
Activities aimed at reforming the system of professional education have been implemented in Russia since early 20ies. In order to retrace the changes, including motivations, incomes and working time, labour practices, problems and expectations of educational personnel, in the framework of Monitoring of education markets and organizations (MEMO) during several years Higher School of Economics has been conducting special research. In 2012 the object of the survey was investigating the current situation and trends in the following directions: labour strategies of teachers and second employment, academic activity (teaching and research, advanced training), assessment of quality of services provided by an education institution, criteria of a good teacher and those of a high quality of education, assessment of the significance of developing students’ competence, resources of educational personnel, relations between students, teachers and the management.
In 2012 the sample of the survey included 51 lower vocational education institutions (592 persons), 51 secondary professional education institutions (635 persons), 86 higher education institutions (1190 persons).
All those surveyed considered that most important features of their profession are a creative character of work and correspondence of work with one’s inclinations or education. And only seldom they indicated that there was nothing attractive for them in this profession or that they failed to find some other job (see Table 1).
Table 1. Motivation of labour, 2010-2011, combined data array, %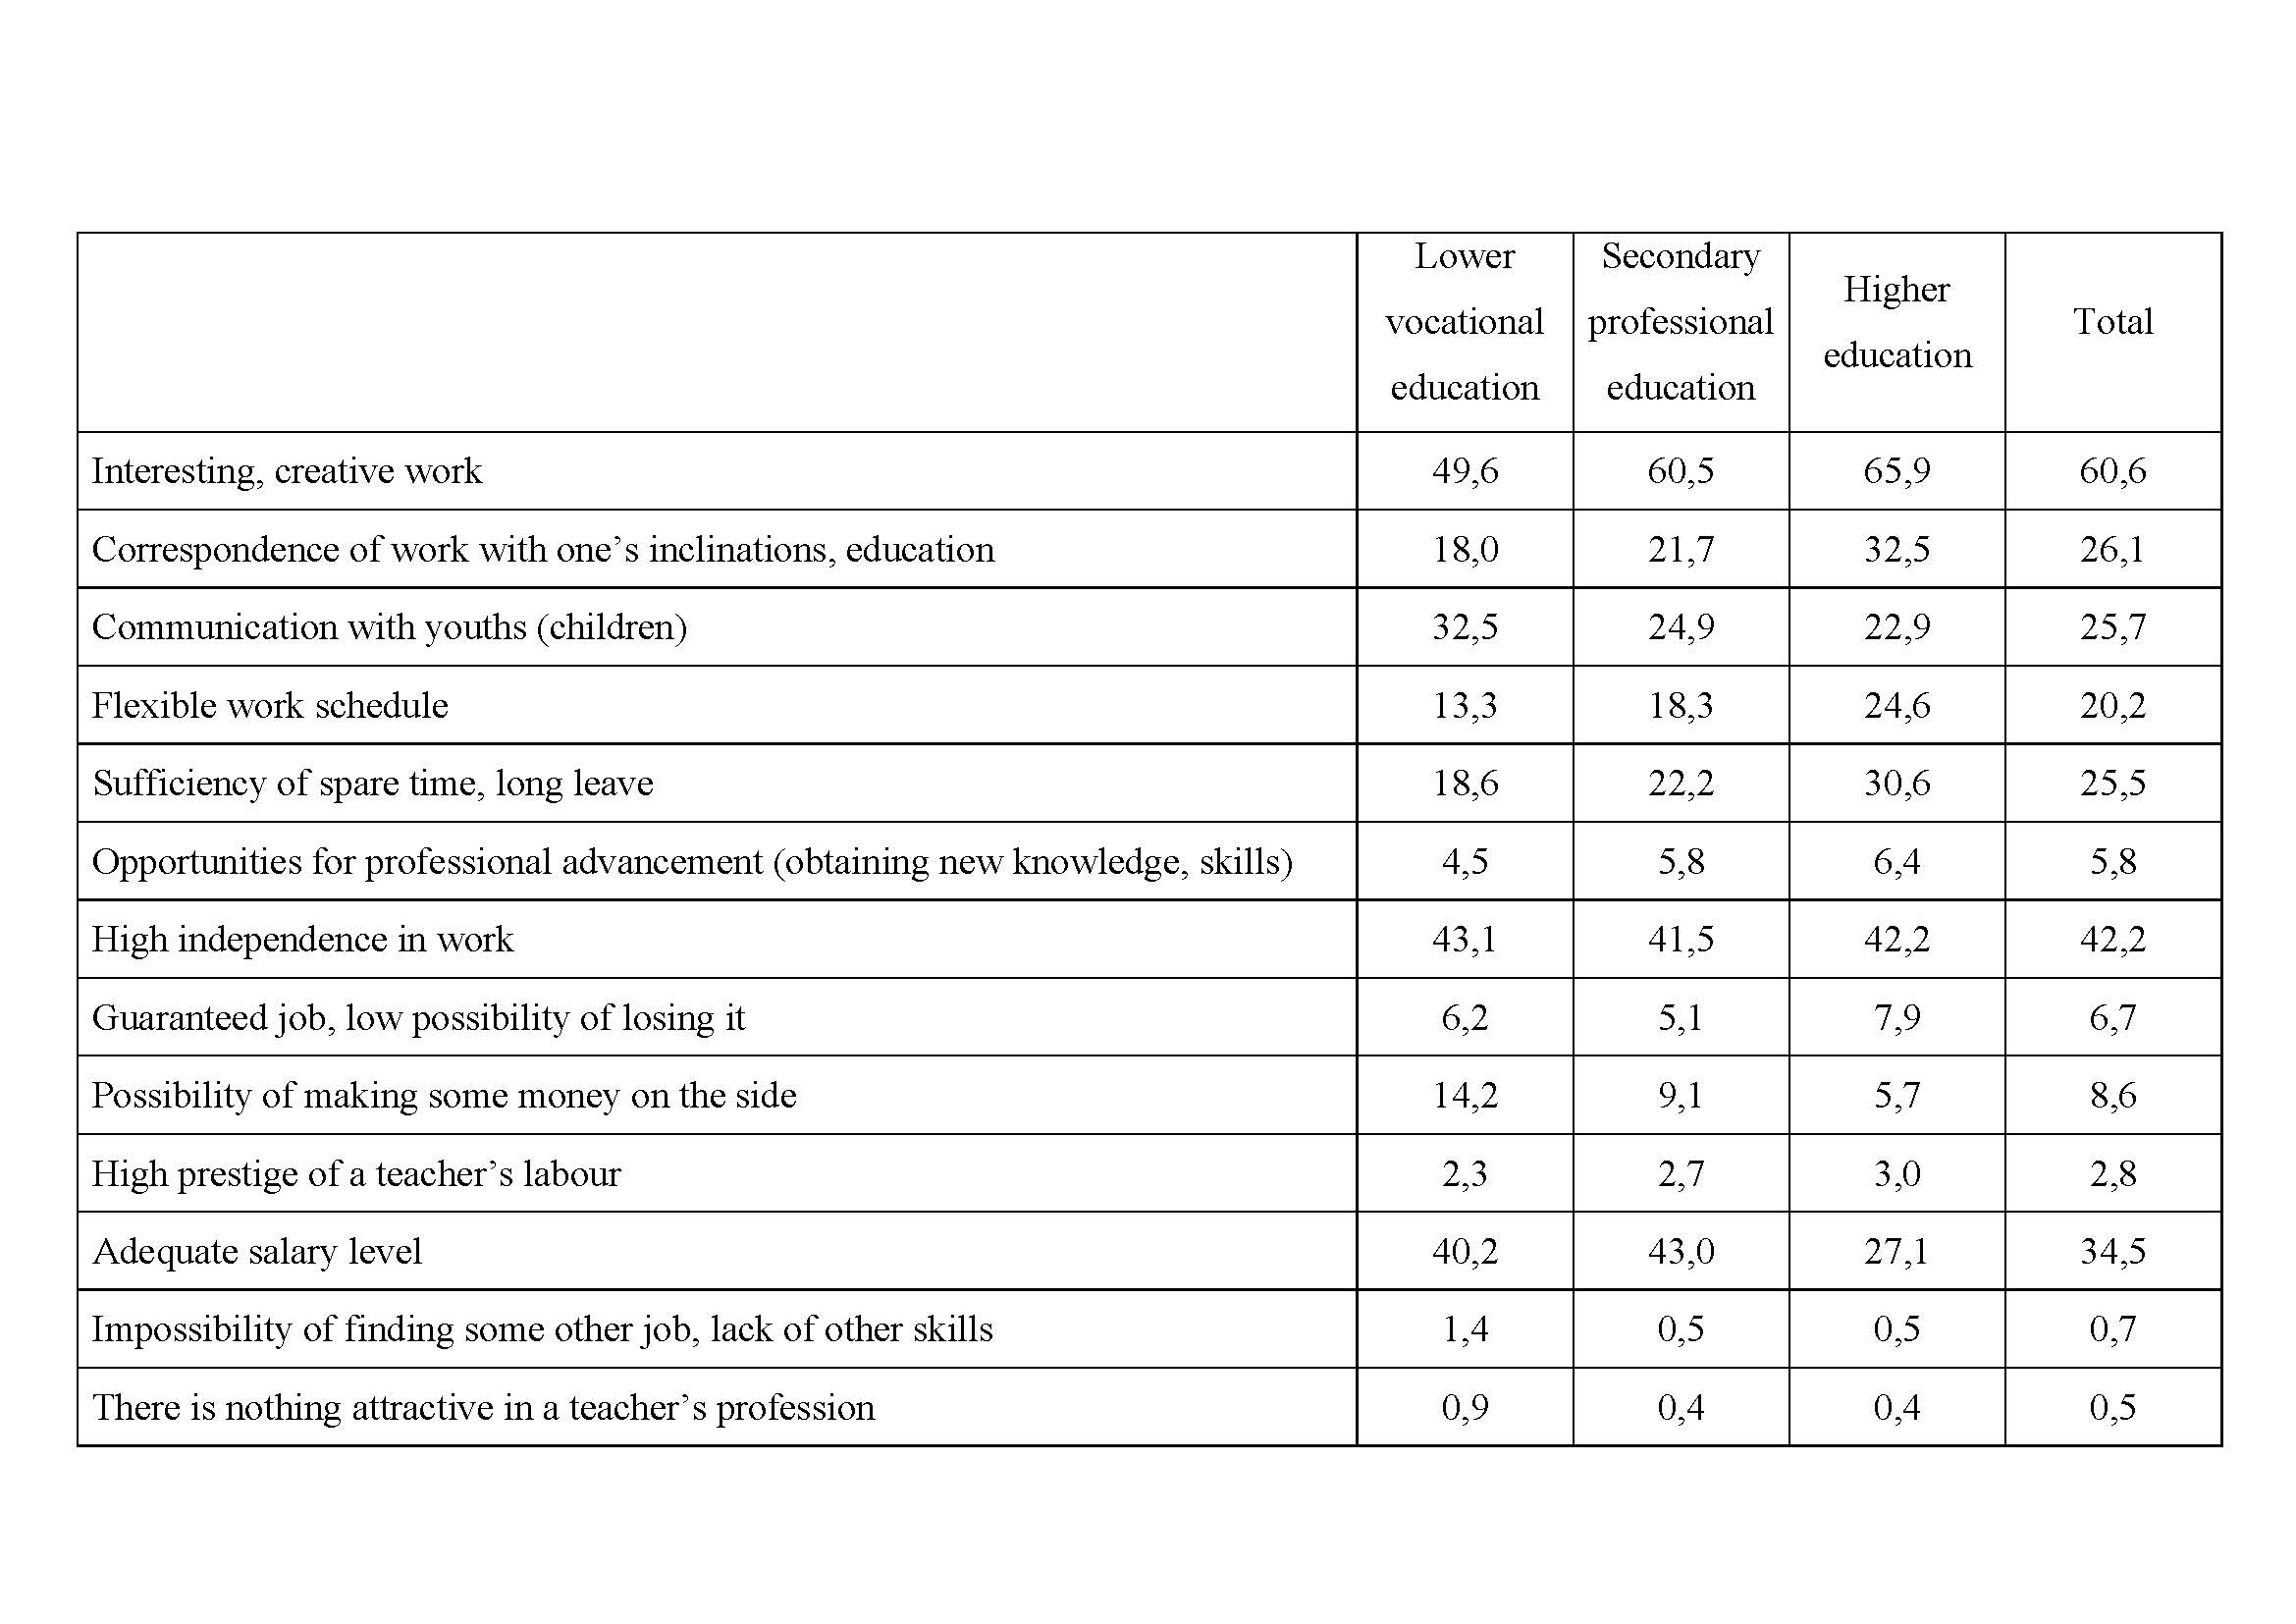
Question: "What is most attractive for you in this profession? (tick off 2-3 most important answers)"
Based upon the cluster analysis four types of labour motivations were specified: “career-oriented” (18,7% of the sample), “leisure-oriented” (27,4%), “comfort-oriented”.(26,3%), “oriented to work with youths” (27,6%).
At all institutions there is a relatively small proportion of external multiple jobholders among teachers; somewhat higher is the proportion of those taking two or more positions within an education institution, while the majority of them are persons for whom it is their main job and they are employed full-time .
In the system of lower vocational education the working week of teachers in the Russian regions constituted 36 hours and the salary was equal to 12 thousand roubles per month at their main place of employment. At secondary professional education institutions in Moscow and in other localities teachers worked an approximately equal time: slightly over 39 hours per week. But the salaries of teachers of secondary vocational education institutions in Moscow were more than twice the amount of the incomes of their colleagues in the regions. On an average the Moscovites earned 33.6 thousand roubles, while provincials earned 15.2 thousand roubles. The working week of teachers on the staff in Moscow and in the regions was almost the same (41 hours). But the salaries at higher education institutions as the main employment were almost twice the amount in Moscow: almost 27 thousand roubles per months, while at regional higher education institutions they were less than 17 thousand roubles.
Slightly less than half of teachers in lower vocational and secondary vocational education got any results of their research activity during the year preceding the survey. 18% of persons working in the system of lower vocational education and 33% in secondary vocational education had published works. Among all the surveyed at higher education institutions 86.4% exerted themselves somehow in the research activity during the year and 76.5% had published works. On an average there were 3.2 published works, less than one monograph and 1.75 presentations at conferences per one respondent.
In 2012 teachers of all professional education levels were asked a question what they were dissatisfied with in the work at a given education institution. Low salary level is to be the most negative factor: it was indicated by 52% of those employed in lower vocational education, 44% – in secondary vocational education and 55% – in higher education. At the same time the discontent of persons working at higher education institutions is the highest, although they get the highest salary of all three levels of professional education.
More than a quarter of teachers of all levels are also dissatisfied with a poor social security (i.e. availability of vouchers, additional medical insurance, public catering, etc.). A rather high proportion of respondents at all education levels mentioned that their place of work is far from their home (14-17%). At higher education institutions more often than at other levels there are noted a high teaching load (15%), poor working conditions, such as lack of a workplace, cafeteria, etc. (8%), bad relations with the management (7%). Besides, 20% of respondents from lower vocational education, 25% from secondary vocational education and 24% from higher education answered that they liked everything in their job.
Taking into consideration a rather high dissatisfaction of teachers with their job, it is not surprising that 38% teachers in lower vocational education, 27% – in secondary vocational education and 23% – in higher education mentioned in 2010-2011 that they would like to leave work at a given education institution. Truly only 3.5% of each category make some efforts for seeking a new job (see Table 2).
Table 2. Distribution of answers to the question: “Would you like to change the work at a given institution for some other job or give up work for good?”
(2010-2011, combined data array, %)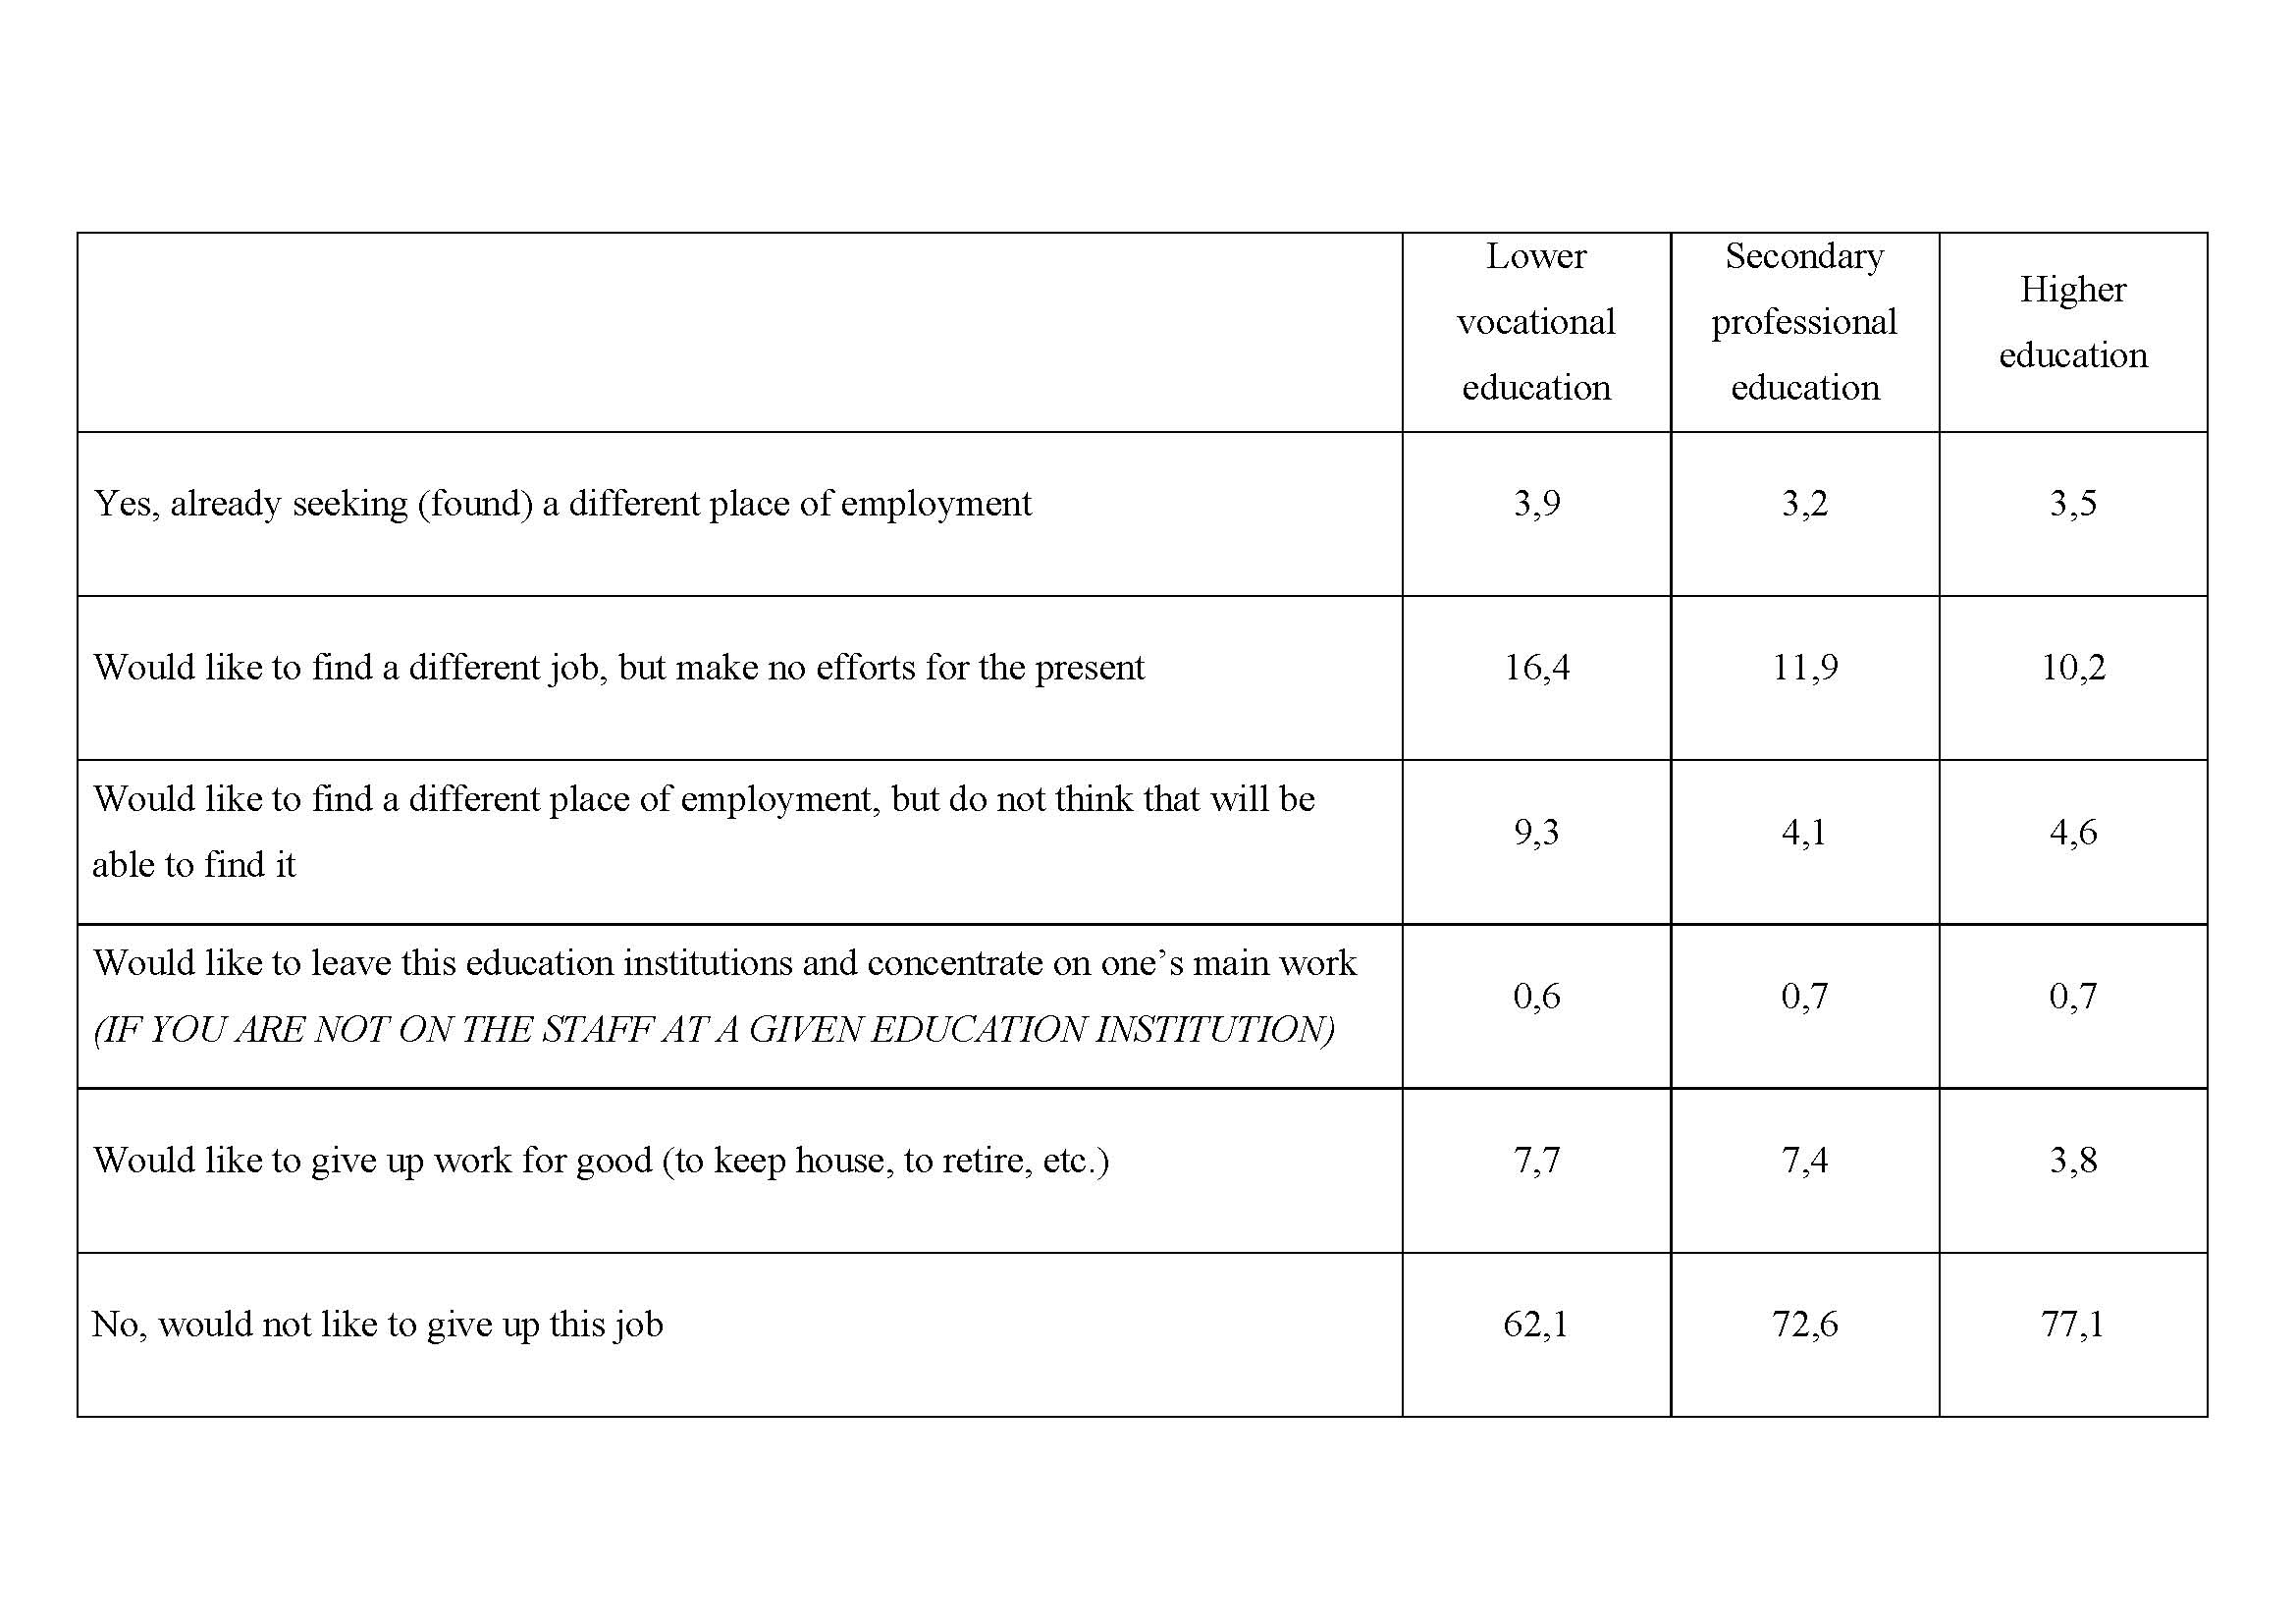
What kind of work would teachers willing to change the place of employment like to find? For those employed in secondary vocational and higher education it is more often changing not a teacher’s work, but an education institution (secondary vocational education – 23%, higher education – 18%). As to teachers of lower vocational education institutions they would more often (21,4%) prefer a job at a state institution, but not related with research and teaching. This type of employment would be chosen by 17% of teachers from secondary vocational education institutions and 16% – from higher education institutions. Teachers of higher education institutions would prefer to be employed in the private sector (10%) or occupied with entrepreneurial activity (10%), as well as to work abroad (10%). Over 11% would be willing to work at a research organization.
What affects the salary level with which teachers on the staff at higher education institutions would agree to change their job for an uncreative one? According to the regression analysis the incomes at the present place of employment have a positive impact on this value. Higher incomes could motivate teachers of higher education institutions in Moscow to change their place of employment. Higher salaries would be expected by professors and associate professors who agree to change their place of employment as compared with those holding a lower position; an availability of published works is also a positive factor. Also distinctive is that “career-oriented” persons are less disposed to changing the place of employment for an uncreative job, and to win them a more attractive proposal would be required in terms of salary level as compared with those who have a different type of motivation.
Teachers assessed most highly the programme of supporting research projects implemented jointly by leading higher education institutions and leading research organizations (it was called important and very important by 66% of teachers in lower vocational education, 72% – in secondary vocational education, 70% in higher education) and the programme of efforts to attract leading Russian researchers to work at higher education institutions (lower vocational education – 70%, secondary vocational education – 75%, higher education – 69%). The assessments of reforms by persons working at higher education institutions differ greatly depending upon specialization. Thus while the establishing of Federal universities is assessed positively by 44% of respondents, their proportion at economical and juridical higher education institutions was 53%, at classical universities – 50% and at pedagogical higher education institutions – only 19%. The setting up of Research universities is considered an important and positive measure by 60.6% of teachers of higher education institutions; however the highest support is characteristic of respondents from classical universities and technical higher education institutions, while at medical higher education institutions it is lowest (46%). The state support of cooperation between higher education institutions and organizations establishing high-technology production was appreciated by 61 % of respondents, but the assessments were highest at higher education institutions in the cultural sphere (65%) and lowest – at pedagogical higher education institutions (53%). One of the least popular measures is the introduction of a two-level system of education (Bachelor’s + Master’s courses) approved by only 26% of teachers of higher education institutions, given this the assessment is lowest at humanitarian and pedagogical higher education institutions – (14-18%). At medical and pedagogical higher education institutions also lowest is the assessment of the programme of development of higher education institutions’ innovation infrastructure (approved by 54%, while the average equals 63%). Over 65% of respondents do not support the introduction of new educational standards as well, given this teachers of pedagogical (approve – only 18%) and humanitarian (approve – 25%) higher education institutions are leaders in giving it a negative assessment.
Prepared by Natalia Kovaleva
%202013_%D0%BE%D0%B1%D0%BB%D0%BE%D0%B6%D0%BA%D0%B0.jpg.(159x225x123).jpg) Full text in Russian (pdf) |
No. 9 (72), 2013
Distant education: characteristic features of attendance status, motivations and strategies of students
Authors: Olga Ozerova, Lyudmila Ugolnova
Distant education is a specific segment of higher education in Russia. Based upon the data of federal statistical observation and results of a special sociological survey conducted in the framework of monitoring of education markets and organizations the most significant characteristic features of this segment as well as peculiarities of forming the demand for related educational programmes.
Contents:
Introduction
Statistical characteristics of the segment of distant education
Fields of study and directions of education
Motivations and strategies of distant students
Conclusion
Distant education is a specific segment of higher education in Russia. Based upon the data of federal statistical observation and results of a special sociological survey conducted in the framework of monitoring of education markets and organizations the most significant characteristic features of this segment as well as peculiarities of forming the demand for related educational programmes. The trends of the main statistical characteristics of distant education (enrolment, entrants and graduates) are considered; peculiarities of formation of the present structure of this form of education by levels of higher education, as well as by field of study and direction of education are examined; socio-demographic characteristics of correspondence students, motivations for choosing this form of education and peculiarities of behavior and strategies in the sphere of education and on the labour market are presented. Although according to statistics its volume, in terms of both the human capital and financial measurement, is sufficiently high.
Beginning with early 20ies the demand for distant education has been constantly growing. Annually from 2005 to 2009 the enrolment of correspondence students (who study simultaneously in the respective academic year) has been increasing by over 100 thousand persons. When compared with the data for 2000/2001 academic year, this tendency becomes still more evident. At that time the enrolment of distant students was practically two times less than at present.
During the period under consideration there was not only an increase of distant students’ enrolment, but also a growth of their proportion in the student body. As the proportion of students studying part-time or in the externship remains stable and low (at the level of 5-7%), it makes sense to compare distant education, in the first place, with full-time studies. The diagram (Fig. 1) presents the change of this correlation in favour of full-time education. As a result by 2011/2012 the proportion of correspondence students exceeded the proportion of full-time students and constituted slightly over a half of the total number of students at Russian higher education institutions.
Fig. 1. Distribution of students of higher education institutions by attendance status in 2000/2001 – 2011/2012 academic years (per cent).jpg)
.jpg)
It should be noted that the described situation in education by correspondence on the whole is in line with the general trend: indicators referring to entrants at higher education institutions have been constantly decreasing in the past years. In this connection especially interesting is the fact that the number of entrants in distant education began to decrease only in the past years, but before that time it was increasing, while the number of full-time entrants was decreasing.
The number of graduates in distant education has been constantly increasing in the past years: during that period the related indicator has increased more than threefold – from 216 000 in 2000 to ХХХХХ in 20ХХХХ. Moreover in 2010 it was for the first time during the period under consideration that the number of graduates exceeded the number of entrants in distant education, although until recently the curves of graduates and entrants were almost parallel.
Approximately a quarter of distant students entered private higher education institutions during the past six years to be compared with only one tenth of full-time students.
Fig. 3. Entrants and graduates at state and private higher education institutions (thousands)
.jpg)
According to 2011 data an absolute majority of distant students (97%) graduated from a higher education institution with a specialist diploma, while the new formats of higher education (Bachelor’s and Master’s courses) at this stage rather seldom go with distant education. The situation takes shape differently at state and private higher education institutions. In the latter 22% of all distant graduates and only 2% from state higher education institutions obtained Bachelor’s and Master’s diplomas.
The proportion of distant students may vary significantly depending upon a field of study and direction of education. Three fields of study – economics and management, humanities, technology of food products and consumer goods – are leading in terms of distant students’ enrolment, while their least proportion was recorded in technical fields of study, natural sciences and medicine.
Based upon the available data one may conclude that there are substantial differences both in the social and demographic characteristics and in the educational and career plans and strategies of full-time and distant students.
Distant students are on an average much older than full-time students. Such difference is to a large extent related with the fact that distant education is chosen by people whose main time is occupied with a professional activity. Whereas among the 20-year-olds such persons are quite few (7.5% in 2011), more than half the representatives of the age group 20-24 years (54,3%) are employed.
The male-female ratio also differs for different attendance status, although not as greatly as the age structure of students. More distinct are differences in the family status of students. The proportions of those who are married and who have children are insignificant among full-time students, whereas among distant students the corresponding indicators are quite high: more than a third of respondents are married and a slightly smaller proportion (30%) has children already.
The formation of educational trajectories of distant students during the period preceding higher education also has important characteristic features: while the majority of full-time students (90%) received complete secondary education (finished the 11th grade at school) before entering a higher education institution, among distant students their proportion is only 60.9%. At the same time only a small proportion of full-time students received secondary vocational education (5.8%) or lower vocational education (5.4%) by the time of entering a higher education institution, while almost a third of distant students of higher education institutions had earlier received secondary vocational education (31.5%) and a considerable part – lower vocational education (16.6%).
According to data of the survey about 40% of distant students graduated from the last education institution not earlier than 3 years before entering a higher education institution, given this for 22% of them that period was 7 years and more. The majority of respondents were employed during the interval in studying, given this 62.6% already had a regular work. Distant students as a rule had poorer progress at school.
The reasons of choosing a higher education institution differ rather substantially for full-time and distant students. What is most important for full-time students, namely high-quality education in the selected field and prestige of a higher education institution, is much less important for distant students as compared with the decisive factors: an availability of distant attendance status and a possibility of combining studies with other activities. Besides those two parameters, virtually all other characteristics of higher education institutions, including those related with the contents of education and with the future career, are less important for distant students. Only the easiness of studying, financial affordability and territorial closeness of a higher education institution are more significant for distant students than for full-time students.
Among reasons that made students to choose exactly distant education is the fact that they are employed and that work occupies their main time. Rather large (15%) is the proportion of distant students who answered that their choice was related with the fact that they had either failed to enter a full-time department, or having assessed their own capabilities they decided beforehand that they would not be able to enter a full-time department. Whereas almost 12% admitted that they had chosen distant education as a more convenient way of obtaining a higher education certificate – they “needed only a diploma, therefore it did not matter whether to study full-time or distantly”.
Distant education is usually selected by person having a certain professional experience, and at the same time they often have regular work. Consequently it could be expected that a speciality acquired by distant students at a higher education institution would be more often related with their activity, because when selecting it they were better informed about their career plans and perspectives than full-time students. However the data of the survey showed that both at full-time and distant departments less than half the employed students had a job related with the profession they were acquiring, although among distant students the proportion of those working according to their speciality is somewhat larger – 47% against 38%. Although this indicator is not too high, for all that one can say that almost half the distant students make their educational and professional trajectories parallel. However in both categories is quite high the proportion of those who do not work according to their speciality and do not relate the future with it.
Prepared by Lyudmila Ugolnova
%202013_%D0%BE%D0%B1%D0%BB%D0%BE%D0%B6%D0%BA%D0%B0.jpg) Full text in Russian (pdf) |
No. 8 (71), 2013
Educational strategies and practices of students of professional education institutions in 2006-2012
Authors:Yana Roschina
A purpose of the section of monitoring education markets and organizations that concerns the surveys of students studying at professional education institutions is examining various aspects of educational strategies of the Russian youths in the sphere of professional education, as well as factors which influence the choosing of such strategies.
A purpose of the section of monitoring education markets and organizations that concerns the surveys of students studying at professional education institutions is examining various aspects of educational strategies of the Russian youths in the sphere of professional education, as well as factors which influence the choosing of such strategies. During the past several years the surveys have been conducted according to a scheme of a panel research of education institutions and base questionnaires which every year include one and the same block of questions, as well as additional questions, this allowing to secure a high degree of comparability and to follow the trend of the main direction of the monitoring.
The themes of the survey of students are sufficiently diverse:
· Investments in the education of students studying at education institutions of different levels: payment for studies, payment for additional services;
· Strategies of students studying at education institutions of different levels: reasons for choosing education institutions, labour strategies during studying, labour strategies in the future;
· Educational trajectories, education quality and accessibility: a social composition of students studying at education institutions of different levels and quality, institutionalized characteristics of the preceding education, an assessment of education quality of education institutions;
· Family capital of students studying at education institutions of different levels: financial, human, social and cultural;
· Organization of an educational process and training practices;
· Assessment of the importance of developing students’ competencies;
· Attitude to plagiarism;
· Participation in the research activities.
The sample of the survey includes 5000 students studying at 50 lower vocational education institutions, 50 secondary vocational education institutions and 85 higher education institutions
As the outcomes of the survey showed, the student body at lower vocational, secondary vocational and higher education institutions is being formed in accordance with a social capital and level of material well-being of their families. The trend of corresponding indicators confirms a stability of this tendency and its development depending upon emerging social and demographic processes.
Among the motives for choosing a higher education institution the young people who are students of higher education institutions indicated such characteristic feature as a good teaching of a profession that they like, as well as other qualitative characteristics. The system of secondary vocational education is characterized by a dual structure of motives for choosing education institutions by entrants. On the one hand the young people want to obtain high-quality education, on the other hand they select more accessible options: “close to one’s home”, “not difficult to enter”, “not difficult to study”. As to students of lower vocational institutions, first come more practical factors – an accessibility of obtaining education: “not difficult to enter”, “not difficult to study”, “close to one’s home”. For all students an importance of payment for studying, as a barrier to accessibility, has been constantly decreasing. The proportion of entrants who have studied at paid courses attached to a given education institution and at other courses, etc. before entering a higher education institution decreases.
Every year a still smaller portion of students studying at higher education institutions note that they have not taken a unified state exam and entered a higher education institution based upon results of entrance examinations only (56.9 in 2006 and 9.1% in 2011). 8.7 % of students noted in 2006 that they had entered a higher education institution based upon results of a unified state exam only, while in 2011 this indicator was equal to 57.9%. Thus a gradual transition to applying the system of a unified state exam for entering a higher education institution may be observed.
During the past years professional education has been requiring investments to a more and more considerable extent. A highest proportion of students studying fully free of charge is in the lower vocational education system (85% in 2012). Among students of secondary vocational education institutions this proportion has increased most of all – from 59 up to 74%. The smallest portion of those studying free of charge is among students of higher education institutions – 61% in 2012. The lowest fee for a year of studies for those who study on a paid basis is in the lower vocational education system in regions, however it has also increased. Students of secondary vocational education institutions in the regions paid 30.9 thousand roubles on the average in 2012, in Moscow – 42.3 thousand roubles. The fee for studying at regional higher education institutions has increased from 28.1 to 53.9 thousand roubles and in higher education institutions in Moscow – from 57.1 to 110.8 thousand roubles.
The answers of respondents concerning households’ potential resources related with paying for studies at higher education institutions (see Fig. 1) testify to the fact that every year the amounts that citizens of Russia are willing to spend on their children’s education have been increasing. It is explained both by the growing value of education in the opinion of citizens of Russia and by the growth of well-being of the population of the country.
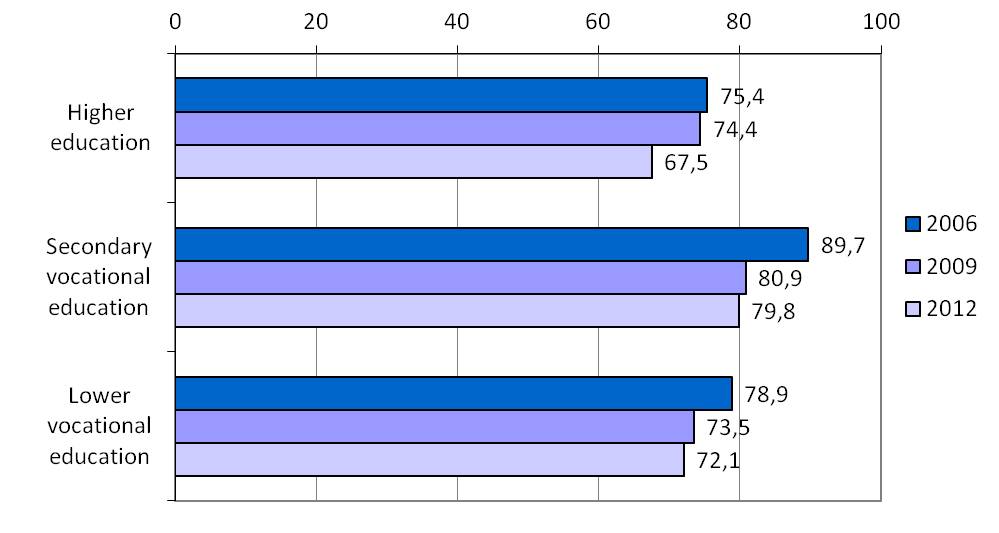
Fig. 1. The proportion of students of higher, secondary vocational and lower vocational institutions studying on a paid basis who have submitted documents directly to a paid form of studies (Answers of students of lower vocational-secondary vocational-higher education institutions, per cent)
The fee per year of studying is lowest in the lower vocational education system (Fig. 2), but in the past period in this segment one would also observe a substantial increase – almost four-fold (from 7 to 24 thousand roubles per year on the average). Higher are fees at secondary vocational institutions (in 2012 in the regions – almost 31 thousand roubles, in Moscow – over 43 thousand roubles) and still higher they are at higher education institutions. A fee at the latter is constantly increasing; at regional higher education institutions and especially at Moscow higher education institutions during 2006-2012 it has increased more than twice and reached on the average over 100 thousand roubles per year.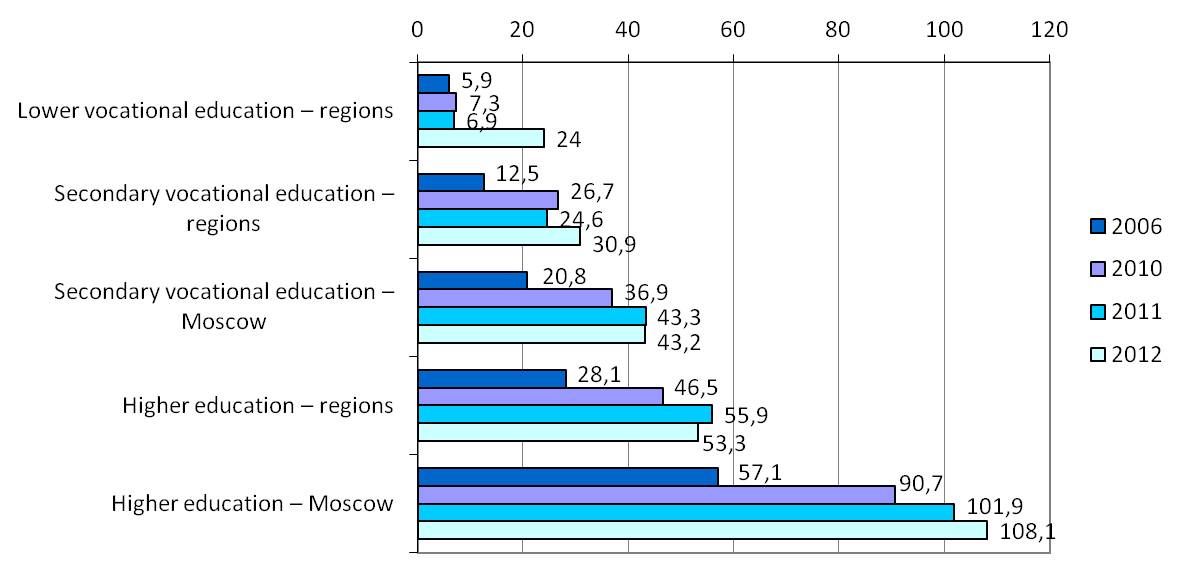
Fig. 2. Distribution of answers to the question: How much money do you pay for your studies this year?
(Answers of students of lower vocational- secondary vocational-higher education institutions, average amount for those paying for studies,
thousand roubles per year)
It is rather significant that paid education at state education institutions (first of all at higher education institutions) appears to be more expensive than at private institutions. Thus in 2012 in Moscow students of state higher education institutions paid over 118 thousand roubles per year, while at private institutions this amount was 87.4 thousand roubles; in the regions the corresponding amounts were 61.1 and 38.4 thousand roubles per year.
A poor practice of conducting electives, courses according to one’s choice, other forms of expanding a content of educational programmes testify to an extremely low variety of education at all levels of professional education, this undoubtedly decreasing a quality of professional education and an opportunity of “adjusting” education in accordance with a labour market demand.
Rather significant are distinctions between students of different levels of professional education in respect of the aims that they want to reach as a result of studying. Students of higher education institutions appreciate higher an opportunity of obtaining a high level of knowledge, as well as that of graduating from a prestigious education institution, as compared to their counterparts from vocational schools and technical secondary schools.
Substantially lower became the proportion of students of the lower vocational education system who are intended to enter higher education institutions – from 50.6% in 2006 to 40% in 2012 (the decrease is equal to 10 percentage points. A similar trend, though less marked, is characteristic of students of secondary vocational institutions: 79.4% in 2006 and 67% in 2012. Quite high, though somewhat lower, is the interest of students of higher institutions in obtaining in the future a second higher education, to study at postgraduate courses, to study abroad, to work abroad. At the same time the intentions of students to continue studies at master courses have slightly grown.
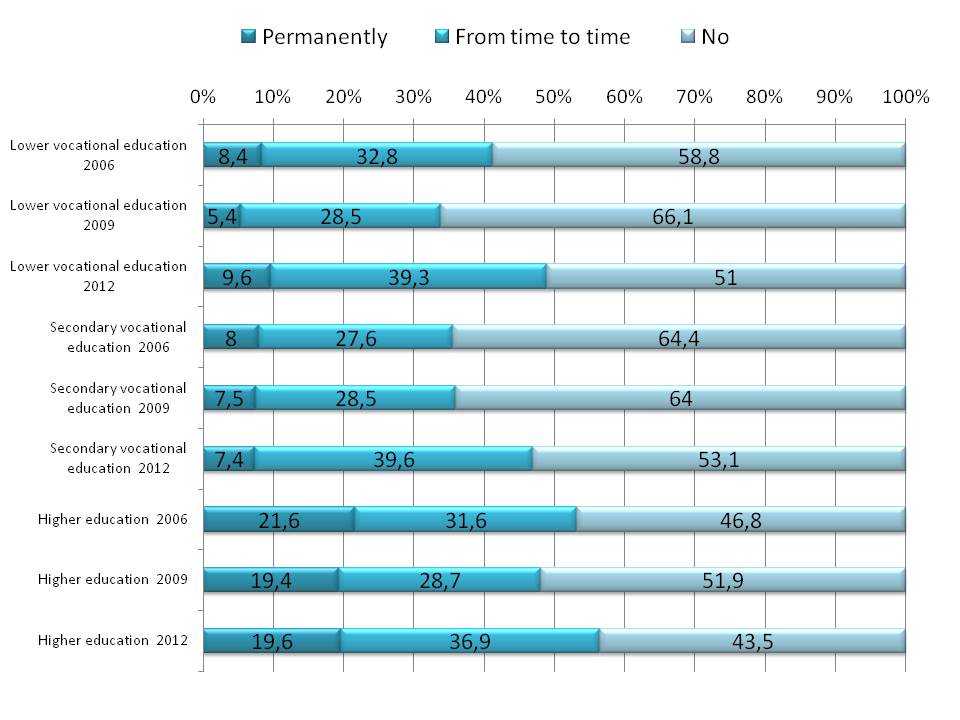
Quite a high proportion of students earn a little extra, but mainly irregularly (Fig. 2). A proportion of those working among students has been constantly growing, though their employment has first decreased during 2006-2009, then somewhat increased by 2012 among students of all levels of education.
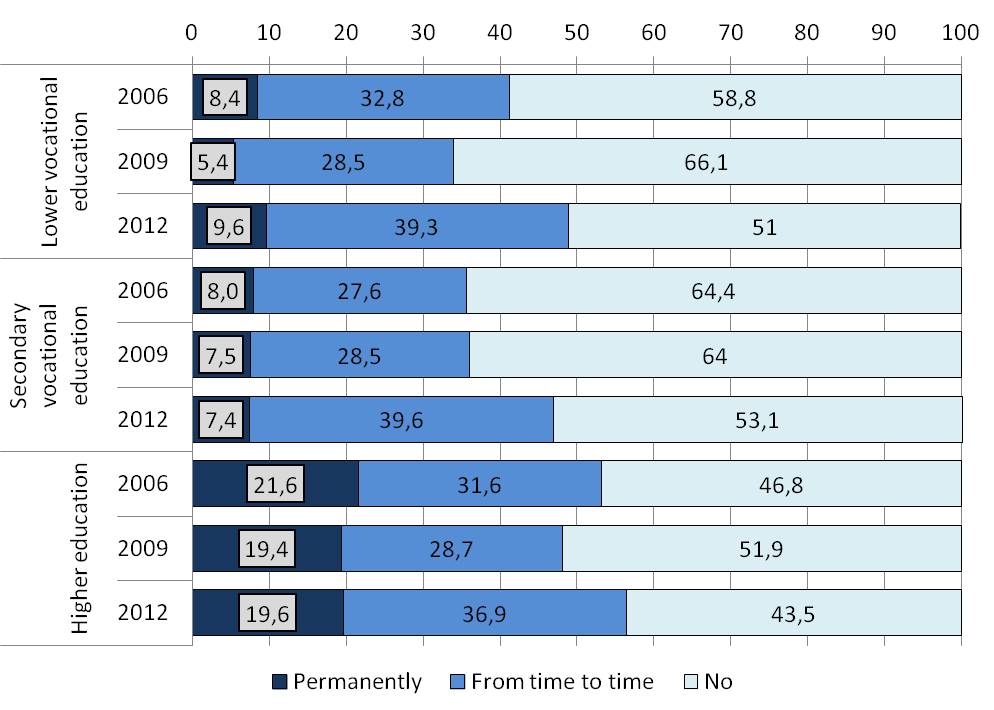
Fig. 3. Question: Will you please say whether you have worked on a paid basis during the past 12 months (or earned a little extra from time to time)?
(Answers of students of lower vocational, secondary vocational-higher education institutions, per cent)
One can see that as the level of education increases, the proportion of those working on a permanent basis is growing: among students of lower vocational and secondary vocational education institutions their proportion was about one tenth, the similar indicator among students of higher education institutions was twice as high. It testifies to the fact that the latter were to a greater extent oriented towards a parallel formation of an educational and a professional trajectory, a timely acquisition of practical skills that are not provided by an education system.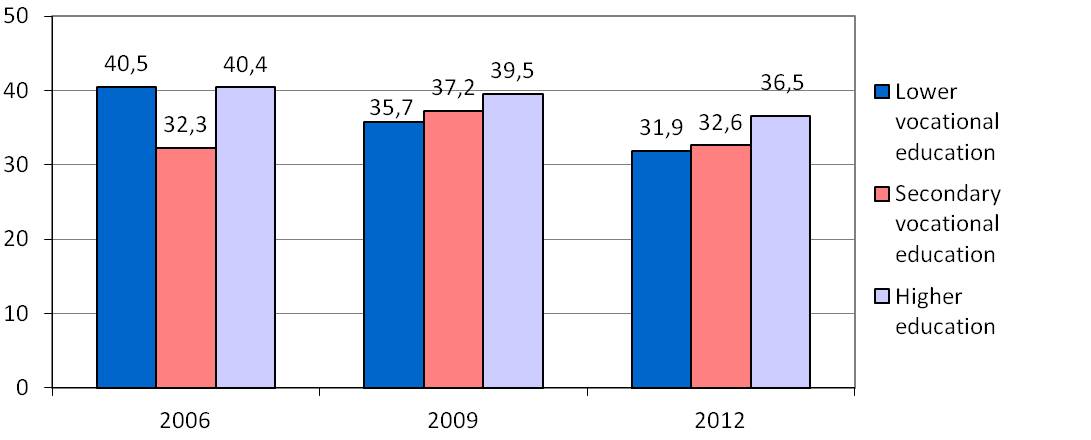
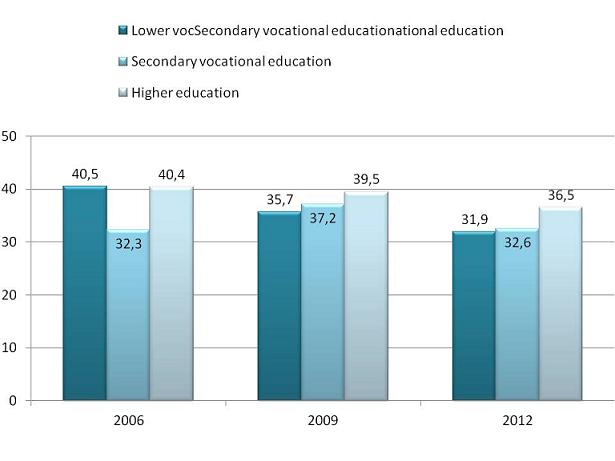
Fig. 4. Question: Was this job related with your speciality in the future?
(Answers of students of lower vocational-secondary vocational-higher education institutions who answered “Yes”)
At all levels of education the proportion of students whose household had a computer increased: the growth was from 17 to 36 percentage points. 97% of households with students of higher education institutions, 94% of households with students of secondary vocational education institutions, 84% of households with students of lower vocational education institutions possessed a home computer in 2012. Quite high are also computer skills and those of using different services via the Internet first of all among students of higher education institutions.
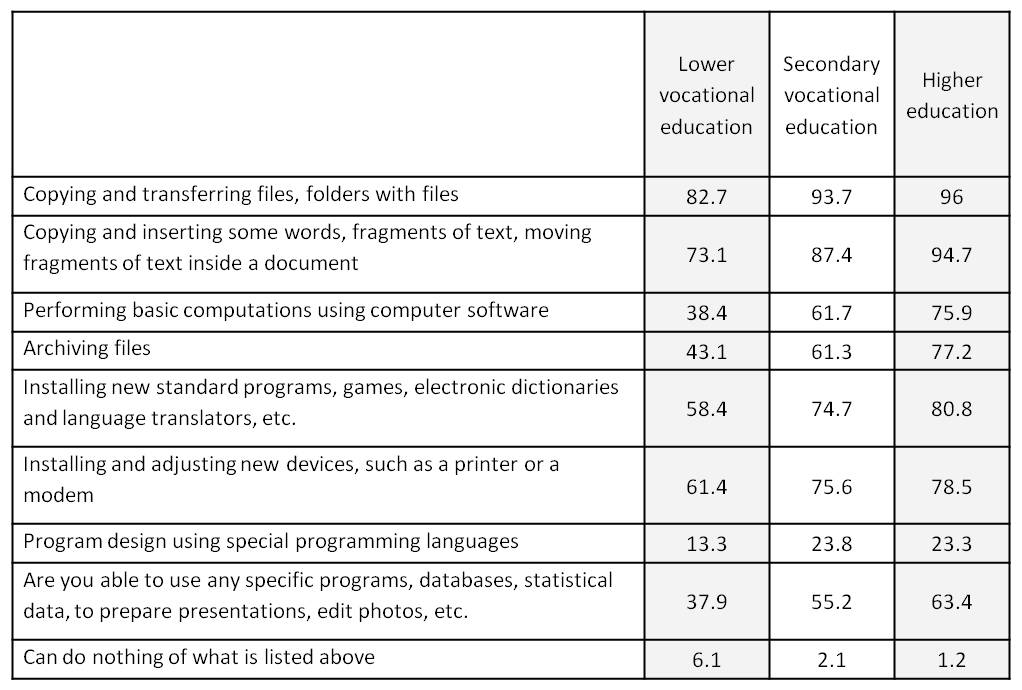
As expected, the computer skills are higher among students of higher education institutions (Table 1): the majority of students can do such simple operations as copying and transferring files and parts of text (a minimum proportion of 73% is among students in lower vocational education). More complicated operations (using spreadsheets, installing new software and devices, etc.) presenting no difficulties for over three thirds of students of higher education institutions are not evident for many students of the same age from lower vocational education institutions. Over a half of students in secondary vocational education and over 60% in higher education have also a complete command of using some specific programs, while a proportion of such students in lower vocational education is substantially lower (38%).
The skills of programming are spread worst of all for obvious reason; however only a quarter of students of higher education institutions, as they confess, are able to do this.
Table 1. Question: " Can you use a computer for ..." Answers of students in lower vocational, secondary vocational and higher education, 2012, per cent.
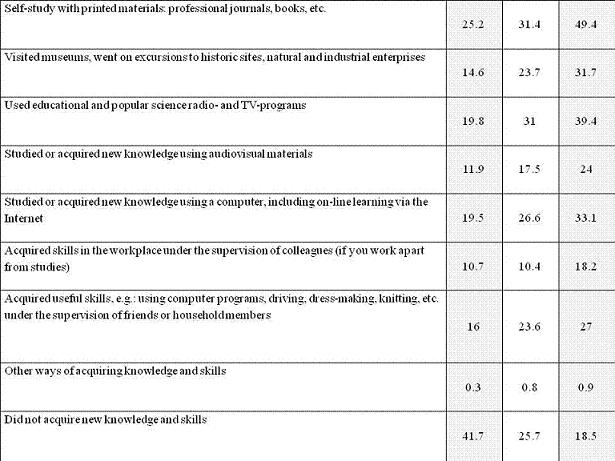
Despite the discovered sufficiently low interest in distance learning as such, many students increase their human capital in various ways (Table 2).
Table 2. Distribution of answers to the question: During the past three months did you use any ways of acquiring new knowledge and skills, apart from those which were components of studies at a given education institution? (Per cent)
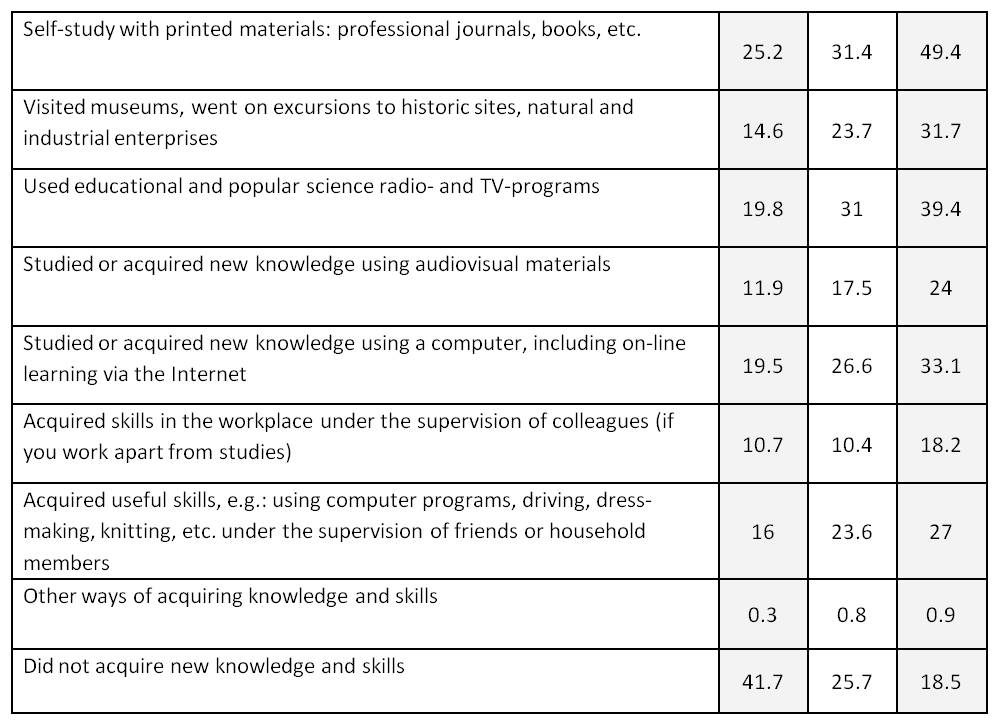
For the present printed materials (professional journals, books, etc.) are used more often: they were read by a half of respondents at universities, almost a third – at secondary vocational education institutions and a quarter – at lower vocational education institutions. Fairly many students watched educational and popular science programs on TV (40% among students of higher education institutions), acquired new knowledge using a computer or the Internet (33% at higher education institutions), visited museums or went on excursions (32% at higher education institutions). Around a quarter of students gained some practical skills with the aid of household members as well as acquired knowledge using audio- or visual records. Among students of secondary vocational and lower vocational education institutions these proportions are 1.5-2 times as lower.
Prepared by Yana Roschina, PhD (economy)
 Full text in Russian (pdf) |
No. 7 (70), 2013
Survey of heads of education organizations implementing non-formal education/training programmes of adults in 2012
Authors:Dinara Borodina, Olga Ozerova
The permanent increase of the information content and speed of information circulation in the modern society have given rise to a phenomenon of an intensive amortization of professional knowledge, primarily in the high-tech manufacturing branches. In this connection the lifelong learning turns into a social institute of an extended reproduction of the society and professional culture of a specialist.
The permanent increase of the information content and speed of information circulation in the modern society have given rise to a phenomenon of an intensive amortization of professional knowledge, primarily in the high-tech manufacturing branches. In this connection the lifelong learning turns into a social institute of an extended reproduction of the society and professional culture of a specialist.
The role of non-formal professional education/trainingin the modern education system of Russia is determined by its effect on the competitiveness of economy, reproduction of the intellectual potential of the society, provision of a social support and rehabilitation of citizens. This is achieved by providing timely professional orientation, obtaining new professions, specialties and additional qualifications, increasing the level of competences required for fulfilling the labour functions in the course of production activity.
The necessity of developing and improving non-formal professional education/trainingis acknowledged by all branches of authority, educational community, professional associations of employers, as well as by employers and employees themselves.
Adequate development of the sphere of non-formal education/training of adults requires indicators that allow:
· to substantiate the main political objectives in the field of non-formal education/trainingof adults;
· to analyze the development of non-formal education/trainingof adults and current situation on the this segment of the educational market;
· to provide an information exchange;
· to compare national indicators of education development with other countries, seek, generalize and adopt the best experience.
There is need for information that provides a computation of such indicators.
At the present time federal statistical observation of the activities of institutions of non-formal professional education/training has been lost.
Other forms of statistical observation in this sphere have narrow purposes, therefore they cannot represent the situation as a whole. They include investigating non-formal professional education/training of federal officials and officials of RF regions, non-formal professional education/training of employees at organizations, expenditures of organizations related with the payment for external services in the field of non-formal professional education/training and expenditures of organizations on professional training, training of unemployed citizens, expenditures on the training of the personnel of innovative organizations.
It is planned to conduct a complex survey of living conditions of the population on a regular basis (one survey was conducted in 2011) and participation of the population in the lifelong learning (a pilot survey was conducted in 2011).
Apart from statistical observation, some results of sociological surveys are available. For example, there was a special survey of the population “Participation of the population in the lifelong learning”. In the framework of this survey, using a methodology comparable with that of Eurostat, the main indicators of the participation of the population in the lifelong learning were obtained. From this survey “emerged” the statistical module mentioned above.
In the framework of the monitoring of education markets and organizations the surveys of consumers (including employers) and suppliers of educational services are performed. In 2012 a survey of heads of education institutions implementing programmes of non-formal professional education/training of adults was conducted[1]. Its objective was obtaining characteristics of their behavior and strategies as participants of markets of educational services, including information about the market of programmes of non-formal education/training of adults, current state and perspectives of development of institutions, financial and pricing policies, development of the personnel, competition.
A survey of heads of education institutions implementing services of non-formal professional education/training of adults: rectors, pro-rectors of academies, universities, research institutes, corporate universities; directors, deputy directors for educational work of technical secondary schools, colleges, specialized schools, lyceums, etc. A total of 150 respondents were surveyed.
The survey of heads of institutions providing services of non-formal professional education/training, given the lack of exhaustive statistical data, is an extremely important source of information on the development of this segment of the educational market. Its results provided answers to some questions that concern the policy regarding the content of non-formal professional education/training, as well as the personnel, pricing and organizational policies of the surveyed organizations.
The majority of respondents, taking their organizations as an example, assess positively the perspectives of development of non-formal education/training of adults (see Fig.1).
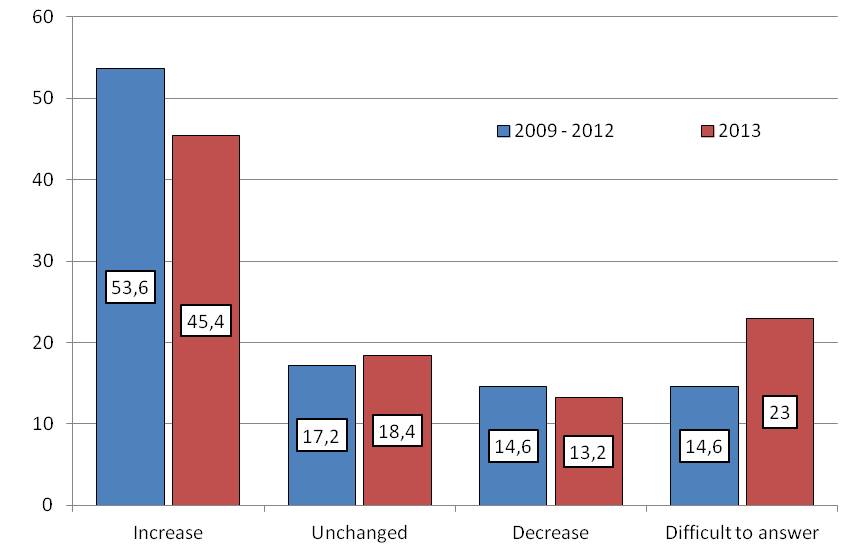
Fig. 1. Assessment of income flows from programmes
of non-formal professional education/training
95% of heads of education institutions are, on the whole, satisfied with the financial state of their organization; the situation was assessed as poor by the remaining 5%.
Over the past three years in more than a half (54%) of education institutions one would notice an income growth from the implementation of non-formal professional education/training programmes, 17% had a constant income level, 15% of respondents indicated a decrease of the amount of financial flows. Half of respondents expect that the income from implementing non-formal professional education/training programmes will increase in 2013, a fifth of the heads believe that incomes will not change, while only 13%, on the contrary, give a pessimistic assessment of the income flows (Fig.1).
The number of students of non-formal professional education/training programmes increased in 53% of organizations over the past three years; 30% believe it to remain unchanged on average; 15% note a decrease. 41% of respondents expect a growth of a corresponding indicator; about 13% are pessimistic; a third of respondents believe that the number of students will be the same. 12% of heads of education institutions find it hard to assess even a short-term perspective in this regard.
As far as educational product is concerned, most widespread are training programmes aimed at updating the knowledge and skills of persons who have got a professional education in connection with the growing requirements to the their qualification level and a need of mastering new methods for solving professional tasks – these are medium-term programmes with a duration of 72 to 500 hours. They are implemented by 94% of respondents. Then follow short-term programmes with the duration of less than 72 hours – they are implemented by 73% of the surveyed organizations.
A regular update of the contents of programmes takes place at organizations implementing non-formal education/training. Over the past three years the contents of more than a half of the non-formal professional education/training programmes was revised considerably, and this was initiated rather frequently by consumers of educational services themselves: every fifth revision was initiated by program attendees, every third – by attendees’ employer (customers of education/training).
A widespread practice is cooperation with the real sector. The most significant direction of cooperation between organizations implementing non-formal professional education/training and employers is inviting specialists from enterprises as teachers for a whole course or its part (72%). 58% of educational organizations are engaged in a joint development of educational programmes; 41% provide traineeships.
About half of organizations confine themselves to issuing a standardized certificate of the organization, a fifth part issues certificates of associations of Russian employers. 9% of education institutions certify mastering a technology of foreign companies and organizations.
When determining a price of a programme almost all organizations (90%) look at an average market price, a deviation from it being slight. None of the surveyed heads evaluate the education/training substantially higher than that that of analogs; 7% of institutions do “dump”. Almost 5% of heads consider their educational products of non-formal professional education/training to be unique on the basis of various aspects of a programme. A flexibility of a pricing policy is provided by a system of discounts. Most widespread are discounts for loyal customers – both individual persons and organizations that assign their employees to training.
Almost 60% of experts support introducing special loan schemes for studying at non-formal professional education/training programmes. In their opinion this will allow to make these programmes more affordable.
Almost all of the surveyed heads (93%) experience competition on the educational market, among them 40% – a severe competition and 53% – a certain competition. In this connection 82% of organizations conduct a marketing research of non-formal professional education/training programmes in their core segments. According to assessments by heads of education institutions a competition is perceived most on the part of higher education institutions (59%) and organizations of the segment of non-formal professional education/training (55%); closing the group of three strong competitors and being somewhat behind, there are corporate training centers (35%). As to research organizations that possess a substantial intellectual potential, experts do not consider them being particularly competitive.
Organizations that have no real competitors for lack of similar services on a regional market feel themselves quite successfully. Such organizations do not feel any pressure from their competitors, if any, first of all, owing to a high level of teachers’ qualification, contents and quality of educational programmes and pricing policy.
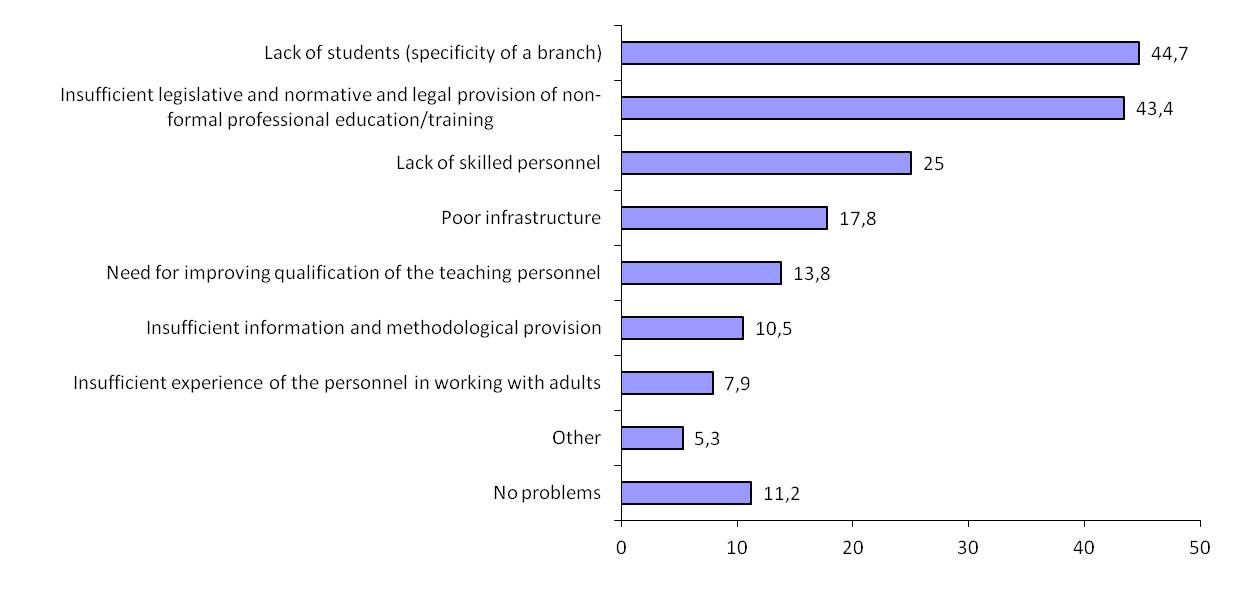
Fig. 2. Main problems that arise when implementing
non-formal professional education/training programmes
Most complicated organizational problems when implementing non-formal professional education/training programmes are related to an insufficient legislative and normative and legal provision in this sphere (43% of respondents); still gradually there is progress in this direction (Fig. 2).
The information collected did not give an answer to all questions that are interesting for parties involved in the development of this segment of the educational market; and in spite of the fact that the survey covered a variety of issues its outcomes displayed a necessity to continue studying the segment of non-formal professional education/training using both the statistical and sociological methods. Unfortunately the development of comprehensive tools of statistical observation of activities of organizations that implement programmes of non-formal professional education/training is being postponed year after year. Researchers have great expectation in connection with the information outbreak related with the introduction of the module “Lifelong learning” in the Survey of the population concerning the employment problem (the pilot survey was conducted in 2011). But still there remain questions of a qualitative character. That is why one more special survey is conducted in 2013 within the framework of monitoring of education markets and organizations with the purpose of understanding in more detail the trend of the demand and characteristics of the main aspects of non-formal professional education/training, namely a survey of consumers of respective services – students of non-formal professional education/training programmes.
****
The results of this survey were presented in May 2013 in Yaroslavl at the XI International scientific and practical conference “Non-formal professional education/training as an effective tool of competitiveness in connection with joining the WTO and the new Federal law “On education in the Russian Federation”. In the resolution of the conference it was noted that there was pressing need to restore the comprehensive statistics of non-formal professional education/training and speed up the forming of a system of monitoring the activity of education institutions in this area.
[1] The survey was conducted in cooperation with the Federal State Budgetary Education Institution of Non-formal Professional Education/Training “State Academy of Industrial Management named after N.P.Pastukhov” (www.gapm.ru).
 Full text in Russian (pdf) |
|
No. 6 (69), 2013
Strategies of preschoolers’ and schoolchildren’ parents in the field of children’s education in 2012
Authors:Yana Roschina
A purpose of the section of monitoring education markets and organizations that concerns the surveys of students studying at professional education institutions is examining various aspects of educational strategies of the Russian youths in the sphere of professional education, as well as factors which influence the choosing of such strategies.
A purpose of the section of monitoring education markets and organizations that concerns the surveys of students studying at professional education institutions is examining various aspects of educational strategies of the Russian youths in the sphere of professional education, as well as factors which influence the choosing of such strategies. During the past several years the surveys have been conducted according to a scheme of a panel research of education institutions and base questionnaires which every year include one and the same block of questions, as well as additional questions, this allowing to secure a high degree of comparability and to follow the trend of the main direction of the monitoring.
The themes of the survey of students are sufficiently diverse:
· Investments in the education of students studying at education institutions of different levels: payment for studies, payment for additional services;
· Strategies of students studying at education institutions of different levels: reasons for choosing education institutions, labour strategies during studying, labour strategies in the future;
· Educational trajectories, education quality and accessibility: a social composition of students studying at education institutions of different levels and quality, institutionalized characteristics of the preceding education, an assessment of education quality of education institutions;
· Family capital of students studying at education institutions of different levels: financial, human, social and cultural;
· Organization of an educational process and training practices;
· Assessment of the importance of developing students’ competencies;
· Attitude to plagiarism;
· Participation in the research activities.
The sample of the survey includes 5000 students studying at 50 lower vocational education institutions, 50 secondary vocational education institutions and 85 higher education institutions
As the outcomes of the survey showed, the student body at lower vocational, secondary vocational and higher education institutions is being formed in accordance with a social capital and level of material well-being of their families. The trend of corresponding indicators confirms a stability of this tendency and its development depending upon emerging social and demographic processes.
Among the motives for choosing a higher education institution the young people who are students of higher education institutions indicated such characteristic feature as a good teaching of a profession that they like, as well as other qualitative characteristics. The system of secondary vocational education is characterized by a dual structure of motives for choosing education institutions by entrants. On the one hand the young people want to obtain high-quality education, on the other hand they select more accessible options: “close to one’s home”, “not difficult to enter”, “not difficult to study”. As to students of lower vocational institutions, first come more practical factors – an accessibility of obtaining education: “not difficult to enter”, “not difficult to study”, “close to one’s home”. For all students an importance of payment for studying, as a barrier to accessibility, has been constantly decreasing. The proportion of entrants who have studied at paid courses attached to a given education institution and at other courses, etc. before entering a higher education institution decreases.
Every year a still smaller portion of students studying at higher education institutions note that they have not taken a unified state exam and entered a higher education institution based upon results of entrance examinations only (56.9 in 2006 and 9.1% in 2011). 8.7 % of students noted in 2006 that they had entered a higher education institution based upon results of a unified state exam only, while in 2011 this indicator was equal to 57.9%. Thus a gradual transition to applying the system of a unified state exam for entering a higher education institution may be observed.
During the past years professional education has been requiring investments to a more and more considerable extent. A highest proportion of students studying fully free of charge is in the lower vocational education system (85% in 2012). Among students of secondary vocational education institutions this proportion has increased most of all – from 59 up to 74%. The smallest portion of those studying free of charge is among students of higher education institutions – 61% in 2012. The lowest fee for a year of studies for those who study on a paid basis is in the lower vocational education system in regions, however it has also increased. Students of secondary vocational education institutions in the regions paid 30.9 thousand roubles on the average in 2012, in Moscow – 42.3 thousand roubles. The fee for studying at regional higher education institutions has increased from 28.1 to 53.9 thousand roubles and in higher education institutions in Moscow – from 57.1 to 110.8 thousand roubles.
The answers of respondents concerning households’ potential resources related with paying for studies at higher education institutions (see Fig. 1) testify to the fact that every year the amounts that citizens of Russia are willing to spend on their children’s education have been increasing. It is explained both by the growing value of education in the opinion of citizens of Russia and by the growth of well-being of the population of the country.
Fig. 1. The proportion of students of higher, secondary vocational and lower vocational institutions studying on a paid basis who have submitted documents directly to a paid form of studies
(Answers of students of lower vocational-secondary vocational-higher education institutions, per cent)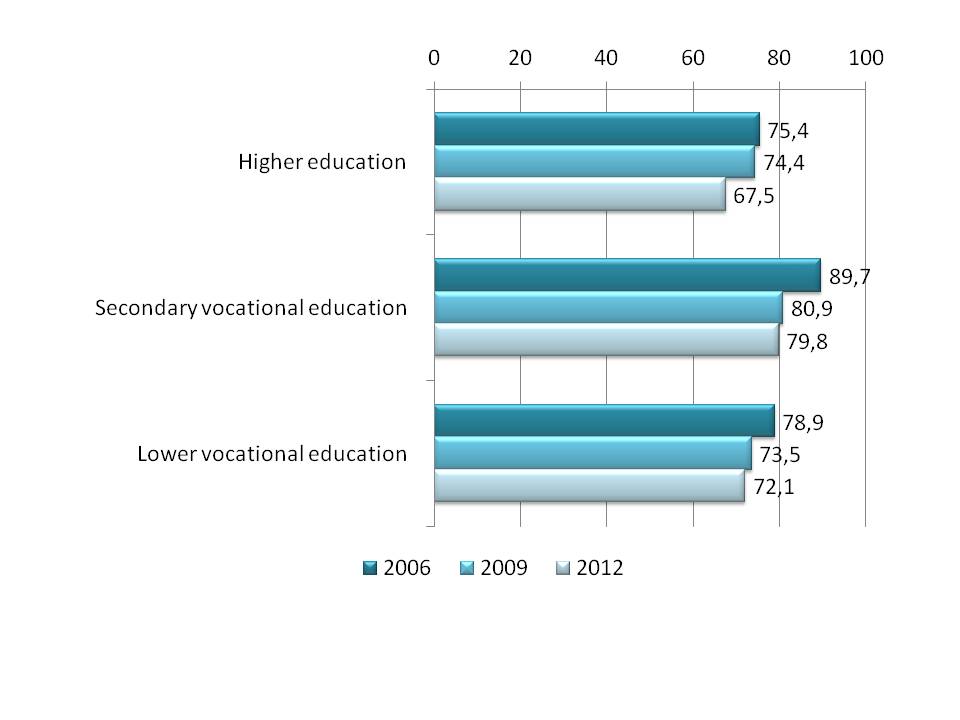
The fee per year of studying is lowest in the lower vocational education system (Fig. 2), but in the past period in this segment one would also observe a substantial increase – almost four-fold (from 7 to 24 thousand roubles per year on the average). Higher are fees at secondary vocational institutions (in 2012 in the regions – almost 31 thousand roubles, in Moscow – over 43 thousand roubles) and still higher they are at higher education institutions. A fee at the latter is constantly increasing; at regional higher education institutions and especially at Moscow higher education institutions during 2006-2012 it has increased more than twice and reached on the average over 100 thousand roubles per year.
Fig. 2. Distribution of answers to the question: How much money do you pay for your studies this year?
(Answers of students of lower vocational- secondary vocational-higher education institutions, average amount for those paying for studies, thousand roubles per year)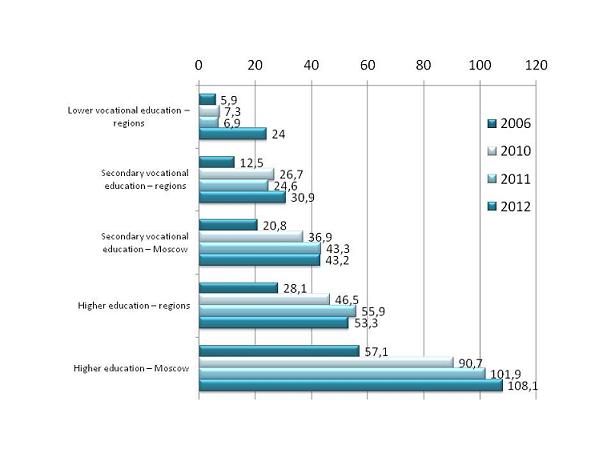
It is rather significant that paid education at state education institutions (first of all at higher education institutions) appears to be more expensive than at private institutions. Thus in 2012 in Moscow students of state higher education institutions paid over 118 thousand roubles per year, while at private institutions this amount was 87.4 thousand roubles; in the regions the corresponding amounts were 61.1 and 38.4 thousand roubles per year.
A poor practice of conducting electives, courses according to one’s choice, other forms of expanding a content of educational programmes testify to an extremely low variety of education at all levels of professional education, this undoubtedly decreasing a quality of professional education and an opportunity of “adjusting” education in accordance with a labour market demand.
Rather significant are distinctions between students of different levels of professional education in respect of the aims that they want to reach as a result of studying. Students of higher education institutions appreciate higher an opportunity of obtaining a high level of knowledge, as well as that of graduating from a prestigious education institution, as compared to their counterparts from vocational schools and technical secondary schools.
Substantially lower became the proportion of students of the lower vocational education system who are intended to enter higher education institutions – from 50.6% in 2006 to 40% in 2012 (the decrease is equal to 10 percentage points. A similar trend, though less marked, is characteristic of students of secondary vocational institutions: 79.4% in 2006 and 67% in 2012. Quite high, though somewhat lower, is the interest of students of higher institutions in obtaining in the future a second higher education, to study at postgraduate courses, to study abroad, to work abroad. At the same time the intentions of students to continue studies at master courses have slightly grown.
Quite a high proportion of students earn a little extra, but mainly irregularly (Fig. 2). A proportion of those working among students has been constantly growing, though their employment has first decreased during 2006-2009, then somewhat increased by 2012 among students of all levels of education.
Fig. 3. Question: Will you please say whether you have worked on a paid basis during the past 12 months (or earned a little extra from time to time)?
(Answers of students of lower vocational, secondary vocational-higher education)
One can see that as the level of education increases, the proportion of those working on a permanent basis is growing: among students of lower vocational and secondary vocational education institutions their proportion was about one tenth, the similar indicator among students of higher education institutions was twice as high. It testifies to the fact that the latter were to a greater extent oriented towards a parallel formation of an educational and a professional trajectory, a timely acquisition of practical skills that are not provided by an education system.
Fig. 4. Question: Was this job related with your speciality in the future?
(Answers of students of lower vocational-secondary vocational-higher education institutions who answered “Yes”)
At all levels of education the proportion of students whose household had a computer increased: the growth was from 17 to 36 percentage points. 97% of households with students of higher education institutions, 94% of households with students of secondary vocational education institutions, 84% of households with students of lower vocational education institutions possessed a home computer in 2012. Quite high are also computer skills and those of using different services via the Internet first of all among students of higher education institutions.
As expected, the computer skills are higher among students of higher education institutions (Table 1): the majority of students can do such simple operations as copying and transferring files and parts of text (a minimum proportion of 73% is among students in lower vocational education). More complicated operations (using spreadsheets, installing new software and devices, etc.) presenting no difficulties for over three thirds of students of higher education institutions are not evident for many students of the same age from lower vocational education institutions. Over a half of students in secondary vocational education and over 60% in higher education have also a complete command of using some specific programs, while a proportion of such students in lower vocational education is substantially lower (38%).
The skills of programming are spread worst of all for obvious reason; however only a quarter of students of higher education institutions, as they confess, are able to do this.
Table 1. Question: "Can you use a computer for ..."
Answers of students in lower vocational, secondary vocational and higher education, 2012, per cent.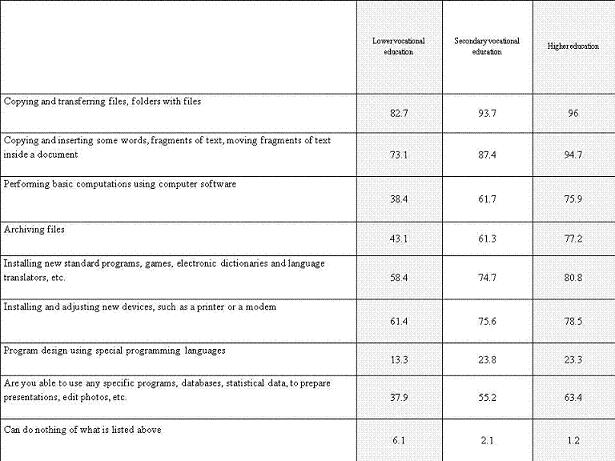
Despite the discovered sufficiently low interest in distance learning as such, many students increase their human capital in various ways (Table 2).
Table 2. Distribution of answers to the question: During the past three months did you use any ways of acquiring new knowledge and skills, apart from those which were components of studies at a given education institution?
(Per cent)
For the present printed materials (professional journals, books, etc.) are used more often: they were read by a half of respondents at universities, almost a third – at secondary vocational education institutions and a quarter – at lower vocational education institutions. Fairly many students watched educational and popular science programs on TV (40% among students of higher education institutions), acquired new knowledge using a computer or the Internet (33% at higher education institutions), visited museums or went on excursions (32% at higher education institutions). Around a quarter of students gained some practical skills with the aid of household members as well as acquired knowledge using audio- or visual records. Among students of secondary vocational and lower vocational education institutions these proportions are 1.5-2 times as lower
Prepared by Yana Roschina, PhD (economy)
.jpg) Full text in Russian (.pdf) |
|
No. 5 (68), 2013
"Policy of education institutions for nonformal education of children according to outcomes of their heads’ survey, 2012"
Authors:Boris Koupriyanov, Sergey. Kosaretski, Tatyana Mertsalova, Tatyana Semenova
It was for the first time that in 2012 a survey of the heads of education institutions for nonformal education of children was included in the annual monitoring of education markets and organizations of the Research University – Higher School of Economics.
The attention to this type of institutions is stipulated first by a lack of comprehensive and consistent picture of their activities under the conditions of social changes and modernization of the education system.
The existing federal statistical observation and the departmental reporting allow collecting information only about some aspects of the activity of education institutions for nonformal education of children and assess them strictly quantitatively. Large-scale surveys of this segment of the education sphere were not conducted in the past decades.
At the same time the specificity of the nonformal education of children, that is displayed in the voluntary character and the liberty of choosing an educational programme and the place where to perform it, in the possibility of designing individual educational trajectories, define a high potential of education institutions for nonformal education of children in resolving the tasks of education and development of children and adolescents in the contemporary sociocultural situation.
Several strategic documents regarding the educational policy that specify the priorities in the development of the system of nonformal education of children were adopted in 2012.
The objectives of the survey of the heads of education institutions for nonformal education of children became the obtaining of topical information on the current situation and tendencies of the institutions’ development and the formation of an empirical basis for elaborating an educational policy in the system of nonformal education of children.
The survey was conducted in 400 institutions including 365 state (municipal) institutions (101 state and 264 municipal institution) and 35 private organizations. 259 institutions belong to “education”, 93 – “culture”, 40 – “sports”; 8 (2,0%) institutions positioned themselves as “other”.
The survey covered the head of education institutions for additional education of children from Moscow, cities with the population over 1 million, from 100 thousand to 1 million, up to 100 thousand people, as well as rural settlements.
As to the “administrative and geographic characteristic” the belonging to one of eight federal districts was applied.
The survey allowed getting data on the contingent and programmes of education institutions for nonformal education of children that add to and clarify the picture formed on the basis of data of the statistical observation. The outcomes of the survey show that:
- preschoolers, school children and adults are studying at the institutions, the pupils of primary and basic level of general school prevailing; the proportion of senior pupils is lower;
- enrolment growth over the past years can be seen in all age categories of pupils, excluding the senior pupils;
- age categories of preschoolers and adults are attractive for education institutions for nonformal education of children as a source of non-budgetary funds: it is they in particular that are granted an advantage to provide paid educational services.
-
The outcomes of the survey testify to the fact that the proportion of primary school pupils in the structure of the contingent is slightly higher than that of adolescents. The proportion of senior pupils is noticeably lower and slightly higher than the proportion of preschoolers (Fig. 1).
Fig. 1. Age structure of pupils studying at education institutions for nonformal education of children
(responses of heads of education institutions for nonformal education of children, 2012, per cent).jpg)
Education institutions for nonformal education of children are characteristic of a wide radius of the territory served by them. At the same time in the structure of the contingent there prevail children living in a micro-district of a city /rural area where an institution is located.
As to the composition of nonformal education programmes (both the network as a whole and within the institutions) there dominate programmes of arts and physical training and sports (Fig. 2).
Fig 2. Directions of programmes implemented by education institutions for nonformal education of children
(responses of heads of education institutions for nonformal education of children, 2012, per cent)
One would notice a certain imbalance between the demand and supply of services in the framework of nonformal education of children: there exist both a competitive admission and problems related with the enrolment in programmes of certain directions.
The survey has shown that, when defining the content of education, the institutions to a greater extent are oriented towards available resources, rather than meeting the needs and demand of children, parents, society and the state.
The specific features of organizing an education process at education institutions for nonformal education of children are, first, the turnover of the contingent during an academic year (excluding sports); second, the prevailing mode of operation (second half of a day), and, third, the availability of programmes of different duration (1-3 years).
The level of provision of programmes for nonformal education of children with resources is, on the whole, satisfactory. At the same time there are problems related with the provision of some directions (scientific and technical, and creative work in technical sports) with equipment and the provision of education institutions for nonformal education of children in the rural area.
In the structure of incomes of education institutions for nonformal education of children there dominate the budgetary funds (Fig. 3). The degree of dependence upon the budgetary financing is the highest at the municipal level in territories with a small size of the population. Most active efforts to attract non-budgetary funds are characteristic of autonomous institutions.
Fig 3. Income structure of education institutions for nonformal education of children
(responses of heads of education institutions for nonformal education of children, 2012, per cent) .jpg)
In the recent years the number of institutions rendering paid services decreased; it concerned primarily education institutions for nonformal education of children in culture and sports. The cost of paid educational services increases, however on average it does not exceed the inflation.
A growth of the amount of financing of education institutions for nonformal education of children, both from budgetary and non-budgetary sources, has been noted. Given this the trends in the change of the amount of financing differs in respect of institutions of different departments, organizational and legal forms and types of territory.
The heads of institutions consider the current financial situation mainly as stable, and on the whole they are positive regarding the prospects of development. Most optimistic are directors of private organizations and autonomous education institutions for nonformal education of children.
An assessment of the perspectives of institutions’ development, options of the state policy in the sphere of nonformal education given by the heads of education institutions for nonformal education of children testify that in the managerial community there prevail paternalistic aims, a low level of readiness, both in respect of institutionalized transformations within the system “from the top” and display their own initiative and activity.
The implementation of the Federal law №-83 has institutionally fixed the differentiation of institutions by the effectiveness of activity and potential of development that has actually emerged. The sector of autonomous institutions shows the best results of various aspects of activity. The processes of the personnel renewal, salary growth and others occur more quickly within this sector. As to some aspects of financial, personnel, marketing policies, a resemblance of autonomous education institutions for nonformal education of children and private organizations for nonformal education of children has been noted.
The age structure of the pedagogical personnel at education institutions for nonformal education of children does not meet in full measure the requirements of the system development, tasks of updating the content and forms of work with children at institutions. (Fig. 4). At the same time in the recent years a tendency of the age lowering of the personnel has been emerging.
Fig 4. Age structure of pedagogical personnel at education institutions for nonformal education of children
(responses of heads of education institutions fornonformal education of children, 2012, per cent)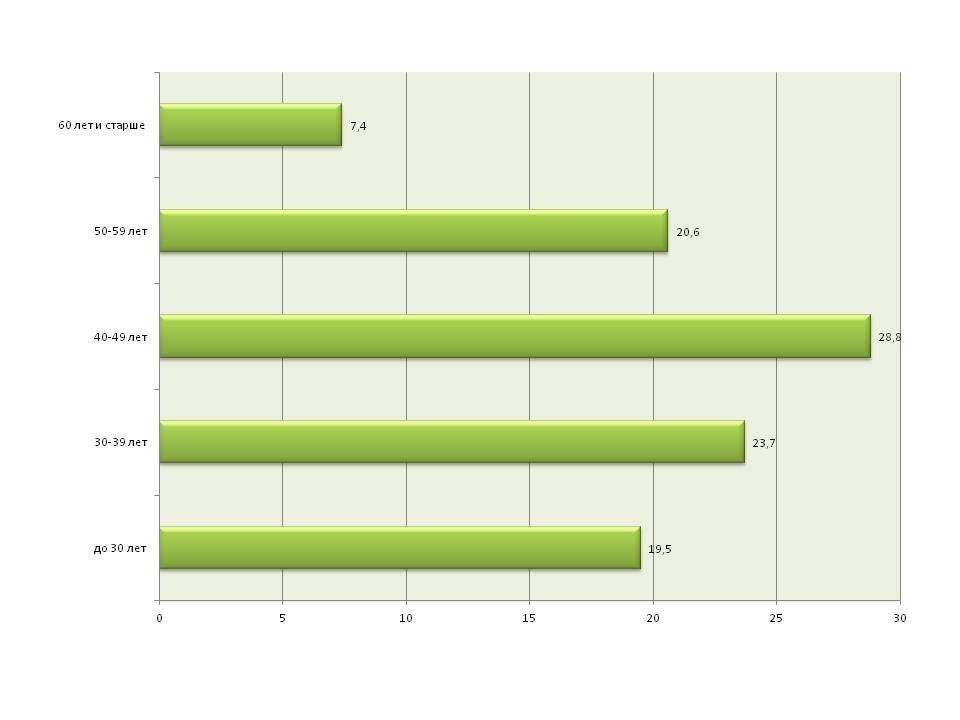
A tendency of salary growth of pedagogical personnel at education institutions for nonformal education of children is taking place, however the trends in this growth is not sufficient for perspectives of a transition to an effective contract. At the present time the salary level under an effective contract is more than twice as much higher than the existing level (Fig. 5).
Fig 5. Salary of pedagogical personnel at education institutions for nonformal education of children
(responses of heads of education institutions for nonformal education of children, 2012, per cent)
High is the proportion of multiple jobholders in the staff of education institutions for nonformal education of children. This allows getting involved in the work with children at education institutions for nonformal education of children the professionals full of initiative from particular spheres (technics, arts, etc.). However under the conditions of introducing new mechanisms of financing and remuneration of labour it will be difficult to preserve this approach (as a minimum in the existing scale).
The existing scale of involving the acting heads in the programmes of professional training (including the retraining) in the field of economics and management does not meet the requirement of increasing the effectiveness of activity under new economic conditions.
The managerial practice of education institutions for nonformal education of children, on the whole, is in line with the state policy aimed at increasing a transparency of educational organizations, expanding a social participation in the management, but at the same time, far as the scale is concerned, it is lagging behind the institutions of general and preschool education as.
The survey of the heads of education institutions for nonformal education of children has revealed a high level of variability of the key parameters of the system of nonformal education of children, this making it a complicated object from the viewpoint of analysis and management. One would notice a differentiation of education institutions for nonformal education of children by personnel, resource, and financial and economic potentials that is stipulated by peculiarities of a status and territory of location, policy of a founder, differences in managerial and financial strategies of the heads.
A high level of non-uniformity requires forming a differentiated approach to solving the task of modernization of the sector, including a transition to an efficient contract with educationalists working at education institutions for nonformal education of children and introducing new financing mechanisms.
Prepared by Sergеy Kosaretski
.jpg) Full text in Russian (.pdf) |
|
No. 4 (67), 2013
«Policy of the general education institutions according to outcomes of the survey of their heads»
Authors:Irina Abankina, Maya Saveliyeva, Sergey Sigalov
The surevey has revealed that a high level of professional characteristics of the respondents being heads of general education institutions, such as an educational attainment, coverage of heads by additional professional education programmes, length of service had been preserved. An educational qualification of school heads is still high: 92.2% of the heads have a higher education.
Contents
Introduction
Characteristic of parameters of the sociological survey of heads of general education schools in respect of their educational and economic strategies
Characteristic of institutions and their heads
Resources
Educational strategies
- Admission of pupils
- Teaching
- Quality characteristics
Financial policy
Personnel policy
- Payment of teachers' labour
- Improvement of teachers' corps
Managing an education institution
Conclusion
Picture of a school head
The surevey has revealed that a high level of professional characteristics of the respondents being heads of general education institutions, such as an educational attainment, coverage of heads by additional professional education programmes, length of service had been preserved. An educational qualification of school heads is still high: 92.2% of the heads have a higher education. The first higher education of the school heads was obtained in the field of pedagogical sciences. The main specializations are “teacher of physics”, “teacher of history”, “teacher of russian language and literature”. A small proportion of school heads have a scientific degree of “candidate of science” (6.4%).
The gender imbalance of the directors’ corps is preserved. Still the overwhelming majority of school heads are women (79.2%) aged 40 to 59 years old having a length of service as a director over ten years. The proportion of women being heads of general education schools who are presented in the sample constitutes on the average 73.2% in all age groups except “below 30 years”. In this age group there are 66.7% of men who are heads of institutions. On the whole the survey has not revealed a tendency changes in the gender constitution of the respondents. Male directors of schools constitute for the sample on the average 20,4% of the directors’ corps.
Resources
As far as the provision of general education schools with the main kinds of resources is concerned, one may notice that a tendency of a high level of provision is preserved. For such kinds of resources as the personnel, training premises, training equipment, multimedia equipment, computers, financing, the level of provision remains higher than the “threshold” one, namely 80%. However the outcomes of the survey show that substantial financial injections in the budgets of general education institutions in the course of implementing the National Educational Initiative in 2010-2012 had lead to an increase of provision of general education schools with a wideband access to Internet resources.
This effects positively a possibility of implementing distant educational programmes, this being especially topical when organizing a net interaction with ungraded rural general education schools located in the regions which are difficult of access and from which it is impossible to organize a transportation of pupils to base schools.
Traditionally the outcomes of the 2012 survey confirm a high degree of development of network interaction: attacting the resources of other education institutions, institutions of the social sphere by using specific legislation (i.e. under a contract) is indicated on the average by almost half of schools.
The development of informational transparancy of schools, provision with educational services of a modern level, particularly pupils in the rural area, leveling the quality of educational services provided by an education system of a region to pupils of rural and urban schools by developing distant forms based on using Internet technologies were the most important directions of implementing the National Educational Initiative.
Financial policy
In 2011 in the regions of the Russian Federation there started the process of transformation of general education schools into new types of budgetary institutions stipulated by the new Federal Law on Education.
In this connection the respondents were asked a question: “Which type of new education institutions do you consider to be most acceptable for your general education institution?” Judging by the outcomes of the survey (the proportion of “No answer” was 93.5%) the heads of education institutions either do not pay attention or are not well-informed of the transformations and consequences related with changes in the typology of education institutions and rely on a founder’s choice.
Indeed the outcomes of the survey show that in most cases it is a founder in particular that initiates the conversion of an education institution into one of the new types. A founder monopolizes the its legally provided right of choosing a new type for an education institution.
On the part of an education institution itself the initiative is taken considerably more seldom. A school heads’ initiative is restrained by an established character of interrelations and communication between a founder and a school head that is supprted by the existing normative and legal base and law-enforcement practice.
The issues of changing financial indicators of general education schools are annually included in a questionnairy of a survey of their heads.
The changes of the financial position of general education institutions in the 2012 survey were compared (as in the 2011questionnairy) for the past three years.
As indicated by the respondents, the amounts of budgetary financing have changed considerably over the past period. One would notice a substancial growth of the amount of the fund of remuneration of teachers’ labour, fund of remuneration of an institution’s activity, norms of budgetary financing of schools.
At the same time in the non-budget receipts of general education schools did not display any changes as appraised by their heads. The amounts raised from activities that yield a profit do not exceed 4,4% in the structure of receipts of a general education school, while the budgetary funds constitute the lion’s share of receipts – from 78,8% at schools located in cities with the pupulation exceeding a millionaire people ( to 96,6% at rural schools. The changes in the structure of receipts of general education schools that followed the implementation of the Federal Law on Education stipulating, among other things, the provision of more freedom to education institutions in attracting (at the expense of activities that bring income) and consequently using non-budget funds have not so far produces a visible effect.
As far as the change in the amount of the fund of remuneration of teachers’ labour over the past three years is concerned, the answers “Growth” were given by practically equal shares of the heads (on the average 65.0% with a standard deviation 1.2%), i.e. the amount of the fund of remuneration of teachers’ labour depends slightly upon a type of a locality where a school is situated. No doubt, the decisive factor of influence on the distribution of respondents’ answers was the implementation of the National Educational Initiative and the “salary project” in 2011.
Beginning with 2011 the ministry of Education and Science of the Russian Federation, jointly with regions of the Russian Federation, have started implementing a project of modernization of general education systems and increase of teachers’ salaries. In 2011 subsidies of 20 billion roubles were remitted from the federal budget to the budgets of regions of the Russian Federation.
It is safe to note that that an increase of an average salary of teachers took place at all comprehensive schools included in the sample.
The proportion of teachers in the staff who are capable to double their income owing to their efficient work with pupils, i.e. the proportion of a kind of “celebrities” in school team, is insignificant and constitutes 3.7% according to the heads’ assessment. It is necessary to note that the outcomes of the survey have confirmed that a positive trend was preserved as far as the norm of per capita financing of comprehensive schools is concerned.
Educational strategy
A new question was included in the questionnaire of the 2012 survey; it concerns the strategies of the classes completion at general education schools at different levels of education (primary, basic, senior). The heads of general education institutions declare that there are no barriers for children at the stage of the classes completion at primary school, but it is not in accordance with the facts. An existance of entrance barriers can be proved by a distribution of answers to the question regarding the enrolment at a preparatory department of a general education school. On the average 21.2% (in moscow 34.0%) of directors answered that the data on the enrolment (at a preparatory department) would grow or the admission would start this year. In Moscow 36.4% of directors (on the average for the sample this answer had been chosen by 35% of school directors) answered that the data on the admission to a preparatory department of a school will remain unchanged in comparison with the previous year. Thus in Moscow 70.8% of directors (34.2% on the average for the sample) confirmed that they use a strategy of selecting a pupil body for their school, this violating the legislation in the education sphere.
Beginning with the level “basic general education” when completing classes the respondents follow three main strategies. The first of them is completing classes of the basic school by pupils of the primary school. The second one means an additional completing the classes of the basic school by pupils from other schools; when vacancies are available it is done without a competition. The third strategy is less explicit. It provides for using a selection of schoolchildren who have mastered a programme of the primary school on a competition basis when completing the classes of the basic school.
As to the completing of the seniour classes, it was indicated that the strategy of completing the basic school classes was preserved. At the same time the applying of the strategy of selecting pupils on a competition basis when completing classes is more explicit (20.6% of answers). It is necessary to note that during the period that had passed since the previous survey of heads of general education institutions (2011) no changes in the educational strategies of heads of general education institutions were recorded.
Leading remains the strategy of providing various educational programmes. There is preserved a considerable scale of the schoolchildren coverage by a pre-profile and profile training. A pre-profile and profile training are in the greatest demand in cities with the pupulation exceeding a millionaire people, this being explained by a variety of opportunities for studying as far as the provision of the main kinds of resources is concerned: high-quality teaching personnel of a school; availability of teachers capable of implementing profile programmes and possessing teaching skills sufficient to teach at a more profound level; high class size and the number of classes of in 10th-11th grades (two or more).
It is for the first time that in the 2012 survey the respondents were asked questions about the structure of the pupil body at their school in respect of place of residence and mother-language. The outcomes of the survey show that pupils from households located close to a school have preference. The proportion of such schoolchildren is on the average 69.3% of the total number of those studying at a school.
The proportion of pupils for whom Russian is a foreign language is at a low level and constitutes 6.2% of the total number of pupils.
Personnel
An analysis of the 2012 survey data revealed that an age structure of the pedagogical personnel had not changed in comparison with the outcomes of the 2011 survey.
The proportion of young teachers is still small an is on the average equal to 12.3% of the total number of teachers.
As the outcomes of the survey had shown it is obviously a consequence of a small number of vacancies of teachers substituted by more experienced teachers of an elder age group. The fact that an age structure of the teachers corps is conserved is explained by preferences of school head when employing teachers.
An attempt to move forward in resolving the problem of the teachers corps renewal during 2012 was a failure. The measures of a social support of young teachers taken by the adminisration at the level of a region of the Russian Federation and a municipality did not lead to an expected effect.
As assessed by experts, there are indissoluble ties between an increase of the education quality and a growth of a pedagogical culture of teachers. Meeting the modern requirements in respect of professional skills of teachers is possible only if they participate systematically in the programmes of improving their qualifications in various forms and at different levels. A continuity of a professional development of the personnel of an educational institution that implements the basic general education programme should be provided by means of mastering additional professional education programmes with a duration of 72 hours and every 5 years at education institutions having a license for the right to execute a given type of an educational activity.
According to outcomes of the 2012 survey the proportion of teachers who had mastered the programmes of professional qualifications improvement was 41.3% of the total number of teachers. Among them there were only 9.4% of teachers who participated according to the personified model.
Managing a general education institution
The outcomes of the survey of heads of general education institutions testify to the fact that the proportion of schools that have an govering body is about 60.7%.
Other forms of the public participation in managing a school are applied on a smaller scale. It concerns such forms as a board of trustees and a supervisory council.
The questionnaire of the 2012 survey included a question containing a model list of issues regarding which an govering body makes managerial decisions. The outcomes of the survey give an idea of priorities that are on the agenda of govering bodies. First of all these are issues getting agreement on the distribution of incentive payments, confirmation of a programme of an education institution’s development, getting agreement on the amendments and addenda in the charter, local acts of an education institution, confirmation of a public report of an education institution, getting agreement on a regimen of studies, getting agreement on the rules of a routine, getting agreement on indicators and criteria of assessing the quality and efficiency of work of the education institution’s personnel.
Prepaied by Sergey Sigalov
 Full text in Russian (.pdf) |
|
No. 3 (66), 2013
"Strategies of the heads of professional education institutions"
Authors:Yaroslav Kouzminov, Dina Migunova, Olga Shuvalova
The surveys of the heads of professional education institutions are a component of the monitoring of education markets and organizations. The purpose of the surveys is to define the degree of compliance of the heads’ strategies with the interests of the state and realities of the progress of society. The conception of the heads of professional education institutions concerning the educational services market and the present state and perspectives of their institutions’ development is studied (the surveyed being both experts and persons who make responsible decisions in the professional education sphere).
The surveys of the heads of professional education institutions are a component of the monitoring of education markets and organizations. The purpose of the surveys is to define the degree of compliance of the heads’ strategies with the interests of the state and realities of the progress of society. The conception of the heads of professional education institutions concerning the educational services market and the present state and perspectives of their institutions’ development is studied (the surveyed being both experts and persons who make responsible decisions in the professional education sphere).
The strategies of the heads of professional education institutions are considered in line with the main directions of the institutions’ policies: in the first place the educational policy which is presented successively: firstly in respect of entrants, then directions of improving educational programmes, and finally strategies of graduates’ employment), pricing, financial and personnel policies. For each direction first an assessment of conditions of an institution’s activities are considered, namely the conditions that are important from the viewpoint of implementing the strategies in these directions.
Factors affecting the choice of one strategy or another are studies annually. Such factors include the perception of the heads concerning the situation of an education institution on the educational services market and on the labour market, this becoming more and more topical in the recent years in connection with the ongoing demographic decline and low incomes of the larger part of the population. The status of an education institution (whether state or private), type of locality where it is situated, sectoral belonging are considered as other factors.
The system of indicators is designed according to a modular principle. The subject blocks containing the main indicators the trends of which are monitored annually and additional indicators describing the surveyed phenomena in more detail which are introduced only once or periodically are formed following this principle.
The specific feature of the 2012 survey is examining the opinions of the heads of professional education institutions concerning the measures proposed in the course of discussing the new law on education: the introduction of a new level in higher education – “applied bachelor’s degree” and concerning the redistribution of budget funds in favour of financing educational programmes of a higher quality and supporting the most gifted pupils (using the threshold results of a unified state exam).
It is the opinion of almost half of respondents of all three levels of professional education that introducing the “applied bachelor’s degree” in higher education will not influence the quality of education in Russia (Fig. 1)[1]. However over a third of rectors of higher education institutions believe that this measure will promote increasing the quality, while every fifth head of a technical secondary school thinks that quite the contrary it will hinder an increase of education quality.
All heads of professional education institutions are more optimistic about forecasts regarding the effect of the budget funds redistribution in favour of financing educational programmes of a higher quality, as well as in favour of supporting the most gifted pupils on the quality of education.
Fig. 1. Respondents' opinions about measures aimed to improve the quality of education
(as a percentage of the number of the surveyed)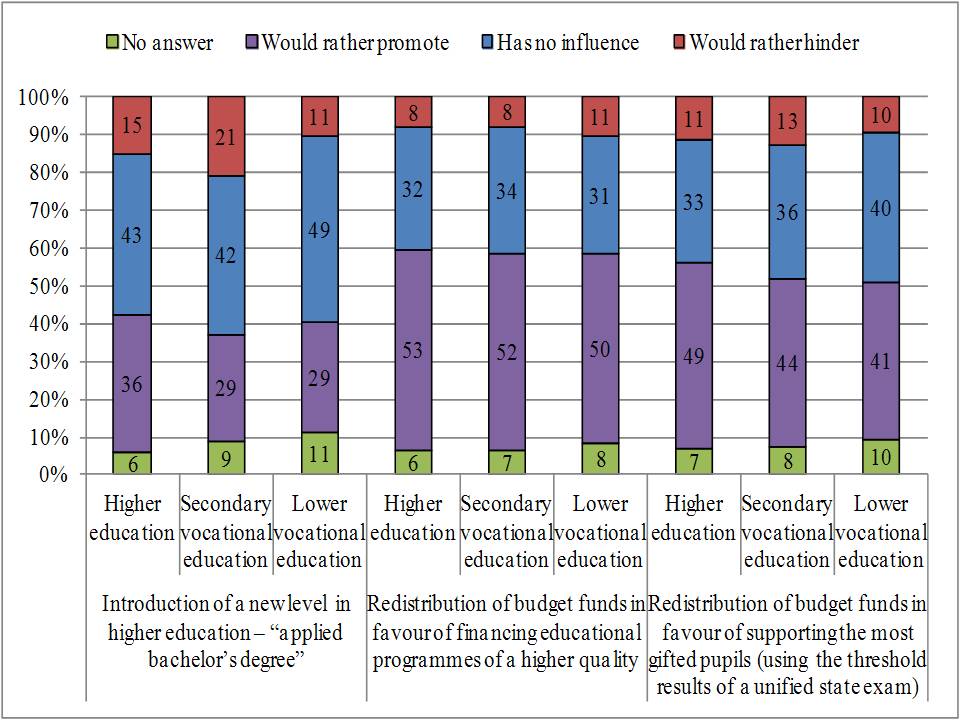
The characteristic features of the surveyed period are the ongoing demographic decline, consequences of the economic crisis, introduction of a unified state examination and introduction of a two-level system of training in higher education. Institutions are still poorly provided with means for improving teachers’ qualification and possibilities for motivating the teaching activity. It has been also revealed that in higher education the provision of research equipment and devices is insufficient; in secondary vocational and lower vocational education this shortage is still more dramatic. In technical vocational schools and trade schools the lack of scientific literature and periodicals has been also revealed (positive trends are noticed only at lower vocational institutions), computer software and databases. However, judging by the trends in the latter indicator, the secondary vocational and lower vocational institutions are eliminating quite rapidly this lagging behind in the IT sphere. As far as the main resource indicators is concerned, there still remains a big gap between higher, secondary vocational and lower vocational education institutions in favour of higher education institutions.
The institutions continue to feel the consequences of the demographic decline which is expressed in the proportion of persons taking entrance examinations. The heads believe that this factor exerts the gravest effect on the financial position of education institutions. However there is likely an entrants growth at education institutions (so far it is most evident at the level of higher education institutions, as twice as many rectors of higher education institutions reported the entrants growth in the current wave in comparison with the past year) (Fig. 2)[2].
Fig. 2. Trends in entrants
(as a percentage of the number of the surveyed)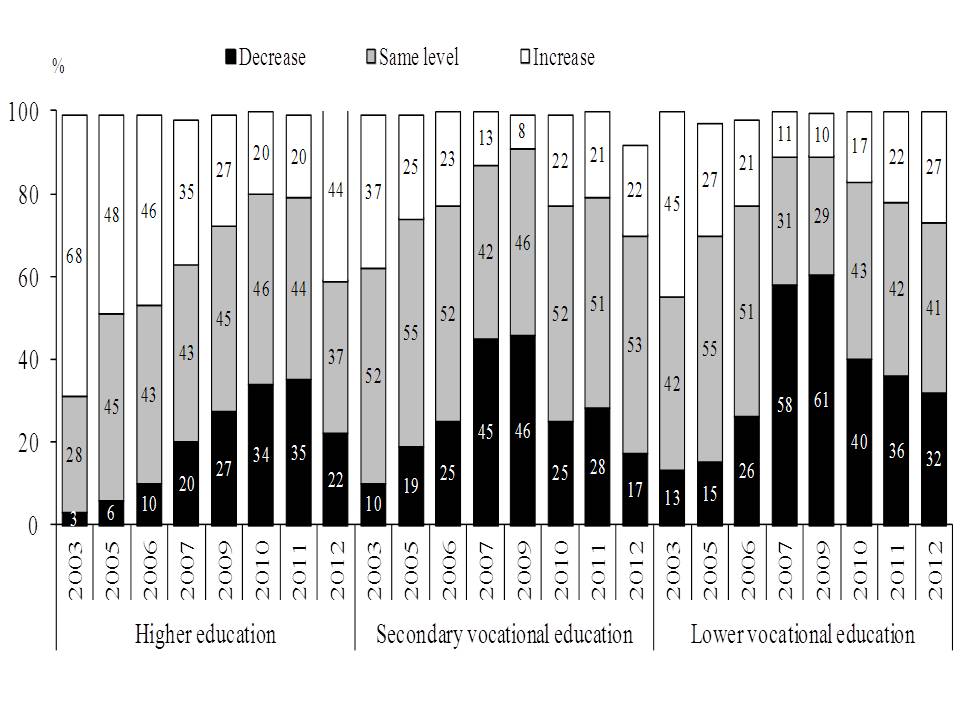
At the same time the proportion of enrolment at higher and secondary vocational education institutions based on a unified state exam has been growing. The level of entrants’ knowledge began to increase: 36% of the management in the system of higher education, 16% in the system of secondary vocational education and 12% in the system of lower vocational education have reported this (Fig. 3)[3].
Fig. 3. Trends in the level of entrants’ knowledge
(as a percentage of the number of the surveyed)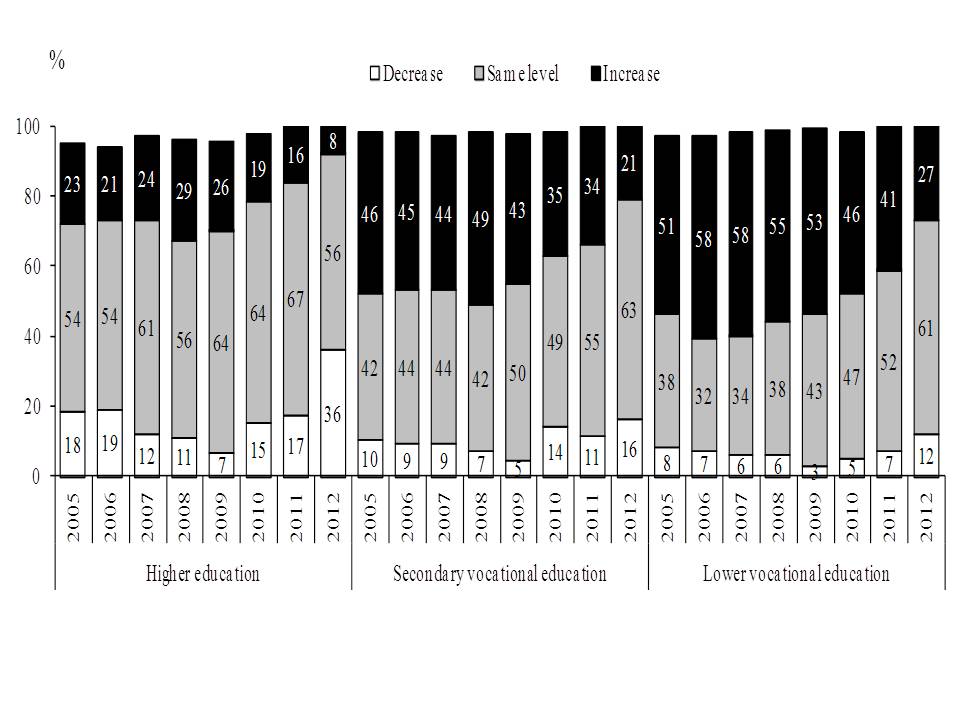
The professional education institutions are gradually approaching the 2003-2005 entrants level, however the situation is still rather complicated. Under such conditions the education institutions have to be more active in respect of attracting entrants, to change their strategies in the direction of improving the quality of educational programmes
The analysis of measures of improving the structure of educational programmes shows that, from year to year, the management of education institutions would focus more frequently on launching new educational programmes, rather than closing some programmes. This leads to a dissipation of resources and lowering the quality of all programmes, including those that could be more successful in case of an effective concentration of resources. In the framework of the past wave the directions of training were surveyed. The survey revealed that an imbalance is more often noticed at higher education institutions, while in secondary vocational and lower vocational education the ratio of institutions that launch and close programmes is approximately the same. Practically each fifth higher education institution launches programmes in economics, social sciences and law (private institutions were more active in this respect as compared to state institutions). Regional and state technical secondary schools started launching programmes in health and life safety more frequently than other professional education institutions. The lower vocational education institutions, in their turn, are leaders in launching educational programmes in the sphere of services and agriculture as compared to other institutions.
The consequences of the economic crisis have been affecting negatively the graduates’ employment. The trends in assessments by the heads of education institutions regarding the perspective of graduates to find a job which corresponds to their speciality indicate that after the worsening of perspectives related with the crisis the situation is gradually improving (Fig. 4)[4].
Fig. 4. Trends in the assessment of perspectives of graduates’ employment
(as a percentage of the number of the surveyed)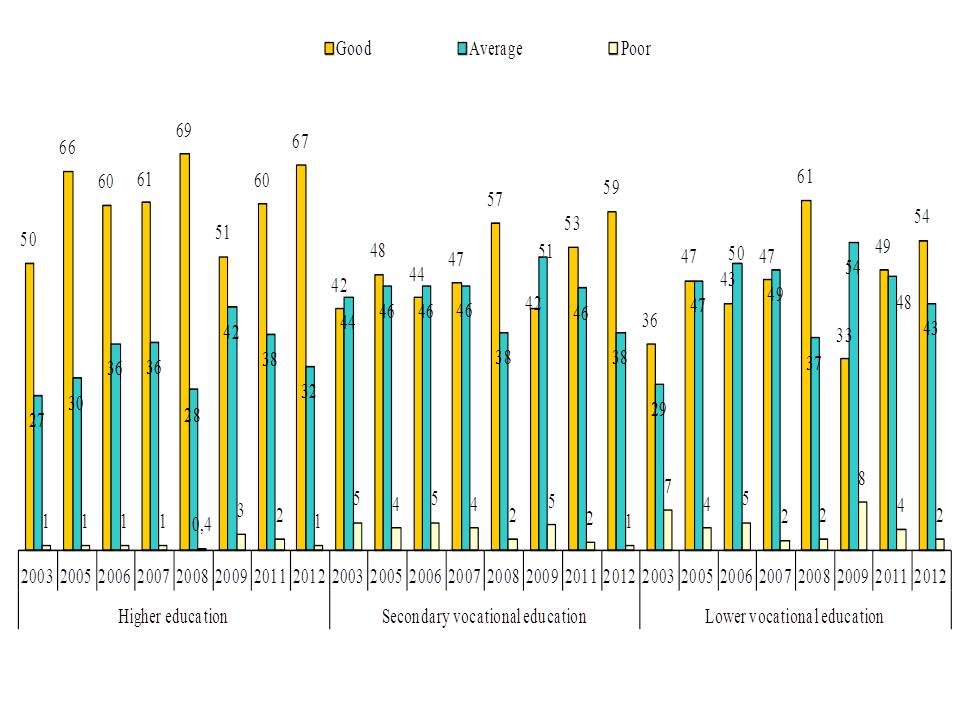
The level of salaries that graduates can expect differs greatly between Moscow and other regions. The results practically differ twice as much in assessing both the best and the worst possibilities of employment, while there is no significant difference between state and private institutions. Graduates of higher education institutions can count on a salary of up to 46 thousand roubles (20 thousand roubles in case of the worst employment). Graduates of technical secondary schools and trade schools can expect getting a salary of 26-27 thousand roubles (in case of the best possibilities) and 15-16 thousand roubles in case of the worst employment.
The crisis phenomena in the economy have indirectly, it being positive, influenced the decrease of the employee turnover among young teachers and the competitiveness in the payment of teachers’ labour at education institutions on the general labour market (this has been reported by the heads of professional education institutions at all three levels). Nevertheless, in their opinion, the average salary of teachers is from one and a half to two times lower than the salary that would allow them to focus on their main activity (i.e. to decline a multiple job holding) and the salary that would allow the management to attract the best teachers to their institutions.
Prepared by Dina Migunova
[1] See Picture 1, p. 2
[2] See Picture 2, p. 3
[3] See Picture 3, p. 4
[4] See Picture 4, p. 5
 Full text in Russian (.pdf) |
No. 2 (65), 2013
«Problems of development of human resources at Russian enterprises and capabilities of vocational training system to solve them»
Authors: Marina Krasilnikova, Natalia Bondarenko, Olga Karaeva
The general economic situation emergingat the surveyed enterprises can be characterized as stagnating; there was no crucial growth in any sector (including the innovative ones, e.g. communication); at best the restoration of the 2008 positions took place. The efficiency of the majority of the surveyed enterprises corresponds to sufficient resources only to resolve their current problems, while the resources for the development and modernization are still lacking
Contents
Introduction
Assessment of general economic conditions at enterprises and that of the demand for labour force
- Development of enterprises and general economic expectations of the management.
- Adequacy problem of the number of personnel with the current needs of enterprises
- Factors of choice when seeking employees on the labour market
- Criteria of choice: characteristics of a diploma, conditions of obtaining professional education or work experience
- Development of computer technologies, requirements to necessary computer skills in employees
- Additional training of new employees
- Scale of hiring higher, secondary vocational and lower vocational education graduates
- Employers’ assessment of individuals who graduated recently from different levels of professional training
- Experience of hiring holders of bachelor’s and master’s diplomas – preferences of employers
Functional duties of personnel departments, availability of annual plans of retraining
- Occurrence of personnel departments at enterprises
- Functional duties of personnel departments
- Participation of personnel departments in the professional training of the personnel
- Occurrence of retraining, advanced training of employees at enterprises
- Scale and amount of retraining, advanced training of employees
- Forms of organizing and directions of conducting the retraining, advanced training of employees
- Initiators of conducting professional training and main directions of training
- Financial expenditures of enterprises on retraining, advanced training, probation of the personnel.
- Survey of enterprises (Eurostat, 2005)
- Participation of enterprises in the professional training of employees
- Employers’ expenditures on the professional training of employees
- Participation of the personnel in lifelong professional training
- Duration of lifelong professional training
- Availability of personnel departments responsible for professional training of employees
- Reasons of refraining from conducting professional training
Appendices
The general economic situation emerging at the surveyed enterprises can be characterized as stagnating; there was no crucial growth in any sector (including the innovative ones, e.g. communication); at best the restoration of the 2008 positions took place. The efficiency of the majority of the surveyed enterprises corresponds to sufficient resources only to resolve their current problems, while the resources for the development and modernization are still lacking. The problem of the personnel shortage which was wide-spread in the period prior to the 2008 crisis and almost not mentioned of during the crisis – is again increasing in the employers’ answers in 2012. The proportion of the enterprises which had informed about the deficit of employees reached the pre-crisis level in respect of the main categories of the personnel: skilled workers – 48% of enterprises, line specialists – 17%.
In the current year the employers’ requirement for a professional education diploma became tougher, this concerning, to a greater extent, the middle and lower personnel. It may reflect a kind of an “adaptation” of the employers to the situation is observed, when the supply of higher education diplomas exceeds the demand of the labour market and the employers, on a mass scale, can afford setting up a claim that even office workers and technicians must have a diploma of a higher education.
Over the past year the employers would solve problem of personnel deficit to a lesser extent by hiring graduates of professional education institutions. At the end of 2012 the employment of graduates from all levels of professional education decreased (from 58% to 46% of enterprises) and was the least for all years when the surveys had been performed. More and more definite became the differentiation of the companies’ preferences in respect of students studying at different levels of professional education. The enterprises of all branches are inclined, to lesser hire the graduates of secondary and vocational education (less than a quarter of enterprises as of 2012). This tendency could be traced even in the economic sector where these categories of graduates had been employed on a mass scale, i.e. in industry.
During the past 5-6 years twice as much of the employers have experience of collaboration with graduates who had graduated from higher education institutions within the framework of the «bachelors-masters» system (their proportion increased from 17% in 2007 to 34% in 2012). About half of the employers who had tried a cooperation of this kind did not notice a substantial difference between the professional skills of graduates who had studied within the former system “specialist” and those who had studied in the framework of the «bachelors-masters» system. When selecting candidates to be employed at the company the majority of employers do not differentiate the level of professional knowledge and skills of persons with a bachelor’ degree and master’s degree, and the lower position of an employee the more indifferent are the employers whether a graduate has a bachelor’ or a master’s degree.
In 2012 the employers were more active in organizing an additional training of the beginners («fitting the job»), and like in the preceding years employers more often provide such training programms to the newly employed line specialists and skilled workers. According to the current survey the employers started to use more often the paid forms of short-term non-formal training (mainly up to 1 month).
Demand for additional training of new employees
(proportion of enterprises where employees needed such training in the number of enterprises that have hired this category of employees in the past 2 years)[1]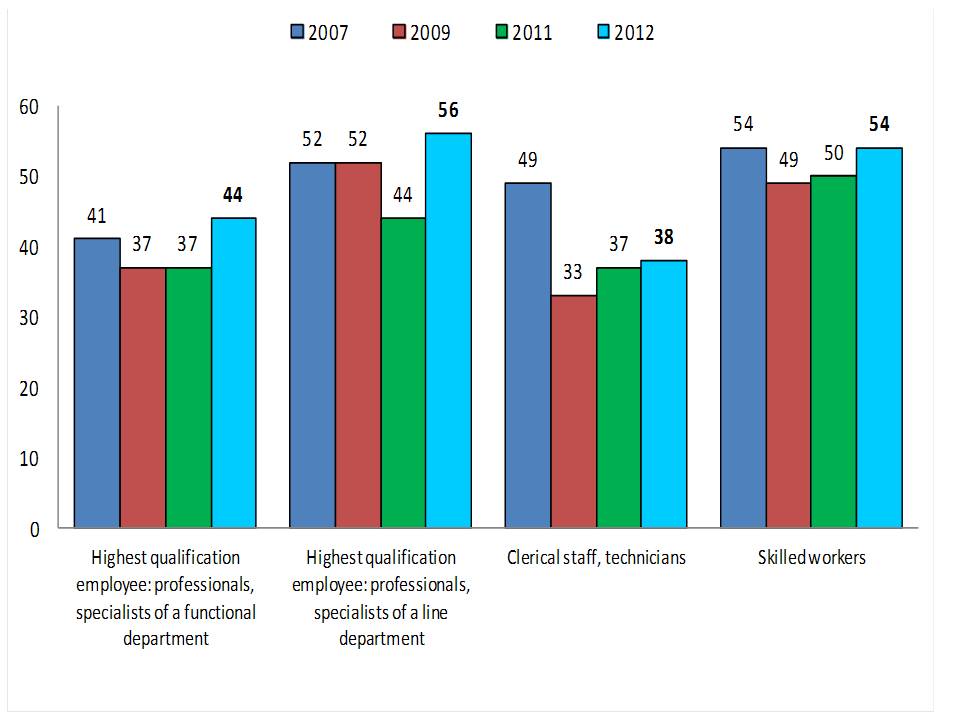
In hiring procedures at the enterprises the value of a diploma’s characteristics (an attendance mode, a list of programmes, an academic progress) are increased slightly over the past 5 years. The characteristics of a diploma in the employers’ decision of hiring recent graduates are still of a minor importance as compared to an availability of work experience.
In spite of a drastic decrease of the employers’ activity in the preceding year, in 2011-2012 there is a revival of the enterprises’ participation in the continuing vocational training of the personnel – 63% of companies provided professional training, retraining, extension courses for their employees. As compared to the previous period most clear was an increase of the proportion of enterprises which provided professional education and training and extension courses to skilled workers. However, on the whole, one cannot say so far that the tendency of the post-crisis curtailing of the personnel training programmes has been overcome. Most of the Russian employers try to maintain the former amount of professional education and training for their employees; even the most economically developed companies are not intended to expand such programmes substantially. The main factors of refraining (or restricting) companies from conducting professional training for last years are presented by the next two pictures.
Reasons of refraining from conducting professional training
(as a percentage of enterprises that did not conduct training in 2005)[2]
.jpg)
Factors that restrict conductingprofessional training
(as a percentage of enterprises conducting professional training)[3]
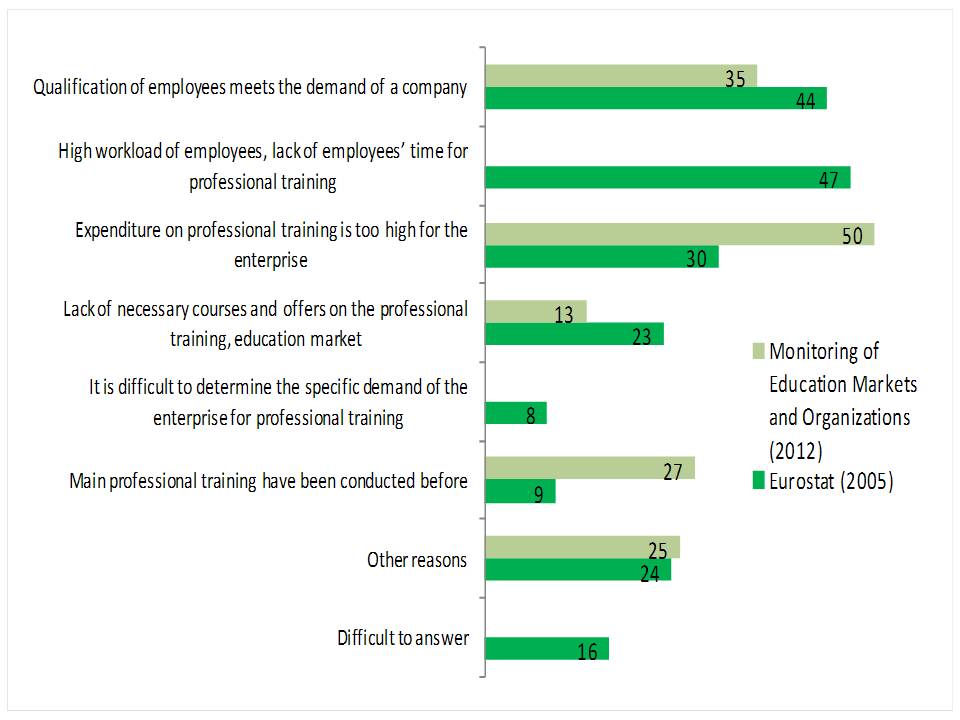
There is a general tendency for time of our monitoring that enterprises which try to provide vocational training are more likely to address to external institutions. During last 5 years here has grown considerably the studying personnel at retraining and professional extension courses, institutes and training centers. And, quite the contrary, cooperation for such personnel training of enterprises with institutions within the professional education system (higher, secondary vocational and lower vocational education institutions) decreased for last time.
At the same time the management of enterprises assesses higher the quality and cost of implementing professional training provided by higher education institutions in comparison with private training companies, personnel recruitment agencies and private consultants.
There are different practices of mutual assistance and exchange of professional experience between a company’s employees. Most widespread is the practice of mutual professional assistance rendered by more experiences employees to the less experienced colleagues, regular assessment of the technological and production process between employees and managers and the heads who attend meetings of this kind at over 85% of enterprises. The less common practices are workshops, master classes, on-the-job training on a regular basis --only 40% of companies conduct them.
Examining the personnel policy of the enterprises showed that at a considerable part of them a personnel policy is implemented based rather on the “residual” principle and not always is goal-oriented. So annual plans of providing professional training and special personnel departments in the structure of enterprises exist only at half of the companies. The worsening of the financial situation of enterprises is directly reflected in the dramatic curtailing of the professional education programmes, whereas the improvement of financial abilities less frequently becomes a motive to expand the scope of training
The participation of the personnel departments in the professional training mostly concern the organizational issues (selection of institutions, programmes, timing), while the initiative of conducting the training of employees is the responsibility of the heads of departments as well as defining the budget of training remains a prerogative of the superior management of the company. At the same time the initiative of the immediate management to provide professional training is determined mainly by the requirements on the part of the superior organizations in connection with the revision of the norms of the working conditions and job safety.
The results as a whole, the personnel departments of Russian companies are weaker comparing them with those in the European countries. As an example, although companies in Russia demonstrated a similar level of engagement to continuing vocational training compare with European companies (if we take to compare the share of enterprises which provide vocational training for their employees), however the amount of investments by enterprises in Europe exceeds considerably expenditure on employees’ professional training, retraining, extension courses of companies in Russia (if we take to compare the amount such expenditures per capita in companies).
Prepared by Natalia Bondarenko,YuriLevada Analytical Center* (Levada-Center*)
[1] See Picture 5, p.16
[2] See Picture 28, p. 51
[3] See Picture 29, p. 52
 Full text in Russian (.pdf) |
No. 1 (64), 2013
Technical notes |
This bulletin presents a statistical survey covering activities of educational institutions in lower vocational, secondary vocational and higher education. The source of information is the data of a federal statistical observation of activities of lower vocational, secondary vocational and higher education institutions. The presented material contains the main indicators of educational institutions’ activities: contingent of students in professional education programmes, personnel potential, condition of the infrastructure and financial resources. Data on the relation between education and the labour market is included. This is the most topical information that was never published before; it has been summarized with the purpose of implementing analytical tasks of monitoring of education markets and organizations.
The objective of the publication set forth in the introduction is to provide various users with high quality assessments of professional education development in the Russian Federation, based upon the data of the state statistics. Such assessments are required for this complicated, dynamic, multilevel system which provides training of specialists who will be given a qualification corresponding to lower vocational, secondary vocational and higher education.
The first part “Main statistical indicators of professional education” contains data characterizing the educational potential of the population. A table presenting the latest statistical information on the progress in professional education not published anywhere before is traditionally included. The most significant tendencies are also described.
Table 1. Main statistical indicators of professional education development[1]
|
|
2000 |
2005 |
2007 |
2008 |
2009 |
2010 |
2011 |
|
Number of lower vocational education institutions, end of year |
3893 |
3392 |
3180 |
2855 |
2658 |
2356 |
2040 |
|
Enrolment in lower vocational education programmes*, end of year: |
|
|
|
|
|
|
|
|
thousands |
1679.3 |
1509.4 |
1256.1 |
1115.2 |
1035.2 |
1006.6 |
921.0 |
|
per 10 000 population, head-count |
115 |
105 |
88 |
78 |
72 |
72 |
64 |
|
Entrants inlower vocational education programmes*: |
|
|
|
|
|
|
|
|
thousands |
844.9 |
687.8 |
586.1 |
540.7 |
542.5 |
609.4 |
532.5 |
|
as a percentage of the population aged 15 years (entrants ratio) |
34.2 |
32.0 |
34.2 |
35.8 |
36.2 |
42.3 |
39.1 |
|
Lower vocational education graduates*: |
|
|
|
|
|
|
|
|
thousands |
762.8 |
702.5 |
656.0 |
604.7 |
537.6 |
580.5 |
516.7 |
|
per 10 000 population employed in the economy, head-count |
118 |
105 |
96 |
88 |
80 |
86 |
76 |
|
as a percentage of the population aged 17 years (graduates ratio) |
29.6 |
29.1 |
29.6 |
31.8 |
31.0 |
37.8 |
34.2 |
|
Number of secondary vocational education institutions, beginning of the respective academic year |
2703 |
2905 |
2799 |
2784 |
2866 |
2850 |
2925 |
|
State and municipal institutions |
2589 |
2688 |
2566 |
2535 |
2564 |
2586 |
2665 |
|
Private institutions |
114 |
217 |
233 |
249 |
302 |
264 |
260 |
|
Enrolment in secondary vocational education programmes, beginning of the respective academic year, thousands |
2360.8 |
2590.7 |
2408.2 |
2244.1 |
2142.1 |
2125.7 |
2081.7 |
|
State and municipal institutions |
2308.6 |
2473.0 |
2288.5 |
2136.1 |
2052.3 |
2026.8 |
1984.0 |
|
Private institutions |
52.2 |
117.7 |
119.7 |
108.0 |
89.8 |
98.9 |
97.7 |
|
Enrolment in secondary vocational education institutions per 10 000 population, head-count |
161 |
181 |
169 |
157 |
150 |
149 |
146 |
|
Entrants in secondary vocational education programmes, thousands |
867.2 |
854.1 |
770.7 |
703.0 |
694.4 |
705.3 |
659.6 |
|
State and municipal institutions |
842.4 |
810.9 |
730.3 |
670.1 |
666.6 |
671.8 |
628.8 |
|
Private institutions |
24.8 |
43.2 |
40.4 |
33.0 |
27.7 |
33.5 |
30.8 |
|
Entrants ratio in secondary vocational education programmes (entrants in secondary vocational education programmes as a percentage of the population aged 15 years) |
35.1 |
39.7 |
45.0 |
46.6 |
46.3 |
49.0 |
48.5 |
|
Secondary vocational education graduates, thousands |
579.3 |
684.4 |
698.5 |
671.1 |
630.9 |
572.1 |
518.0 |
|
State and municipal institutions |
567.7 |
651.4 |
657.0 |
631.7 |
593.9 |
535.7 |
484.2 |
|
Private institutions |
11.6 |
33.0 |
41.5 |
39.5 |
37.0 |
36.5 |
33.8 |
|
Secondary vocational education graduates per |
|||||||
|
10 000 population employed in the economy, head-count |
90 |
102 |
103 |
98 |
94 |
85 |
76 |
|
Graduates ratio in secondary vocational education (secondary vocational education graduates as a percentage of the population aged 18 years) |
23.6 |
27.2 |
30.4 |
30.1 |
33.0 |
32.2 |
33.7 |
|
Number of higher education institutions, beginning of the respective academic year |
965 |
1068 |
1108 |
1134 |
1114 |
1115 |
1080 |
|
State and municipal institutions |
607 |
655 |
658 |
660 |
662 |
653 |
634 |
|
Private institutions |
358 |
413 |
450 |
474 |
452 |
462 |
446 |
|
Enrolment in higher education programmes, beginning of the respective academic year, thousands |
4741.4 |
7064.6 |
7461.3 |
7513.1 |
7418.8 |
7049.8 |
6490.0 |
|
State and municipal institutions |
4270.8 |
5985.3 |
6208.4 |
6214.8 |
6135.6 |
5848.7 |
5453.9 |
|
Private institutions |
470.6 |
1079.3 |
1252.9 |
1298.3 |
1283.3 |
1201.1 |
1036.1 |
|
Enrolment in higher education programmes per 10 000 population, head-count |
324 |
493 |
523 |
526 |
519 |
493 |
454 |
|
Entrants in higher education programmes, thousands |
1292.5 |
1640.5 |
1681.6 |
1641.7 |
1544.2 |
1399.5 |
1207.4 |
|
State and municipal institutions |
1140.3 |
1372.5 |
1384.0 |
1362.7 |
1329.6 |
1195.4 |
1057.7 |
|
Private institutions |
152.2 |
268.0 |
297.6 |
279.0 |
214.6 |
204.0 |
149.7 |
|
Entrants ratio in higher education programmes (entrants in higher education institutions as a percentage of the population aged 17 years) |
50.1 |
68.0 |
75.9 |
86.4 |
89.1 |
91.1 |
80.0 |
|
Higher education graduates, thousands |
635.1 |
1151.7 |
1335.5 |
1358.5 |
1442.3 |
1467.9 |
1442.9 |
|
State and municipal institutions |
578.9 |
978.4 |
1108.9 |
1125.3 |
1166.9 |
1177.8 |
1157.3 |
|
Private institutions |
56.2 |
173.3 |
226.6 |
233.2 |
275.5 |
290.1 |
285.6 |
|
Higher education graduates per 10 000 population employed in the economy, head-count |
99 |
172 |
196 |
198 |
214 |
217 |
213 |
|
Graduates ratio in higher education (higher education graduates as a percentage of the population aged 22 years) |
28.8 |
45.6 |
53.8 |
53.7 |
56.6 |
60.2 |
61.7 |
|
Number of institutions with postgraduate courses, end of year |
1362 |
1473 |
1490 |
1529 |
1547 |
1568 |
1570 |
|
Postgraduate courses enrolment, end of year, thousands |
117.7 |
142.9 |
147.7 |
147.7 |
154.5 |
157.4 |
156.3 |
|
Number of institutions with doctoral courses, end of year |
492 |
535 |
579 |
593 |
598 |
602 |
608 |
|
Doctoral courses enrolment, end of year, thousands |
4.2 |
4.3 |
4.1 |
4.2 |
4.3 |
4.4 |
4.6 |
|
Youths enrolled in lower vocational, secondary vocational, higher and postgraduate education programmes (enrolment in lower vocational, secondary vocational, higher education institutions, postgraduate and doctoral courses as a percentage of the population aged 15–34 years) |
20.5 |
25.0 |
25.2 |
24.8 |
24.5 |
23.8 |
22.7 |
*Beginning with 2010 including students studying according to commercial contracts.
The second part concerns the development and restructuring of the professional education network covering almost 3000 institutions which implement lower vocational education programmes, almost 3000 secondary vocational education institutions and over 500 branches of the institutions, over 1000 higher education institutions and over 1500 of their affiliates. In recent years one would notice a tendency of decreasing of the number of higher education institutions.
The contingent of students in professional education programmes is described in the third part. 9.5 million persons were obtaining professional education in 2011. In recent years there were marked changes in the structure of training. The proportion of graduates in lower vocational and secondary vocational education decreased while the proportion of higher education graduates increased. The characteristics of the contingent are presented from different angles: by educational attainment, by ownership, by gender and age, by field of study and direction of education.
In the fifth part this information is complemented by various data on salaries of the personnel of professional education institutions, this being especially topical in connection with the decisions adopted in this respect at the highest level.
The teaching personnel of professional education institutions is presented in the next part. The corresponding data is differentiated by level of the education system, by institutions’ ownership, by gender and age, by educational attainment, by personnel category, etc.
Although information about the condition of the infrastructure of education institutions presented in this bulletin is rather diverse, such “problem” data seem most significant. As of the end of 2011, 27.2 % of lower vocational education institutions required a capital repair and 4.8 % were in an emergency condition; for secondary vocational education institutions the similar indicators were 11% and 1%. The proportions of the area of hostels in need of a capital repair and those in an emergency condition were 18.6% and 1.6% respectively. Those were mainly state and municipal institutions. In the higher education system almost 10 % of the area of training and laboratory buildings requited a capital repair and аbout 1% were in an emergency condition. The corresponding indicators of hostels at higher education institutions were 20.6% and 1.1%.
The sources of forming the financial provision of an education institution’s activity include budgets of different levels, extra-budgetary funds and own funds. In this bulletin the related information is given quite in detail in different aspects.
The sources of funds vary depending upon the ownership of education institutions. The main source of earnings of state and municipal education institutions is the budget, that of private institutions are extra-budgetary funds. So, in 2011 the budgetary funds were over 80 % in the structure of funds of state and municipal secondary vocational education institutions, and about 60% – for higher education institutions. In private education institutions the proportion of budgetary funds was about 1%. The lower vocational education institutions received 92% of financing from the budget.
In the eighth part a correlation between the educational attainment and the labour market is presented. The educational attainment of the employed population is rather high. According to the 2010 census over 78.7 % of the employed population had professional education, including higher and postgraduate education (31.7%) and secondary vocational education (36.6%). At the same time the proportion of the employed having secondary (complete) general education was almost 16% and that for basic general education – about 5%. A correlation between the educational attainment and unemployment is also presented.
The Technical notes includes definitions of some terms (lower vocational education institution, secondary vocational education institution, higher education institution, number of students studying in professional education programmes, entrants, enrolment, etc.), this making it easier for users to understand the data presented and to interpret it definitely.
Prepared by Irina Zabaturina, Centre for Statistics and Monitoring of Education
Institute for Statistical Studies and Ecomonics of Knowledge
National Research University "Higher School of Economics"
[1] See pp. 8-9.
* Решением Минюста РФ Levada Analytical Center (Левада-Центр) включён в реестр некоммерческих организаций, выполняющих функции иностранного агента.
Have you spotted a typo?
Highlight it, click Ctrl+Enter and send us a message. Thank you for your help!
To be used only for spelling or punctuation mistakes.